Immigrants from Israel vs Immigrants from Somalia In Labor Force | Age 25-29
COMPARE
Immigrants from Israel
Immigrants from Somalia
In Labor Force | Age 25-29
In Labor Force | Age 25-29 Comparison
Immigrants from Israel
Immigrants from Somalia
84.4%
IN LABOR FORCE | AGE 25-29
20.8/ 100
METRIC RATING
195th/ 347
METRIC RANK
87.1%
IN LABOR FORCE | AGE 25-29
100.0/ 100
METRIC RATING
2nd/ 347
METRIC RANK
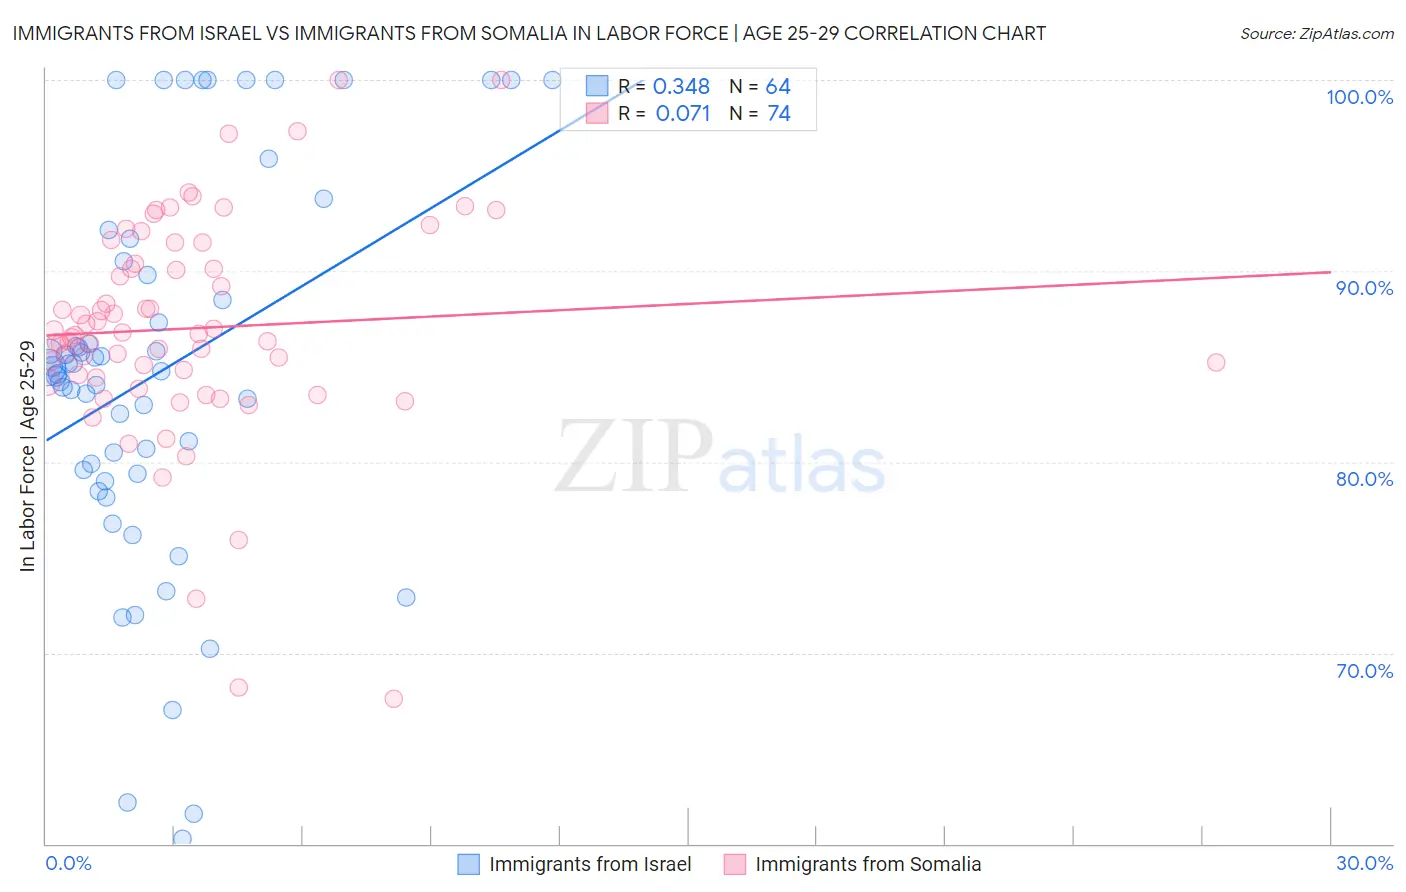
Immigrants from Israel vs Immigrants from Somalia In Labor Force | Age 25-29 Correlation Chart
The statistical analysis conducted on geographies consisting of 209,997,538 people shows a mild positive correlation between the proportion of Immigrants from Israel and labor force participation rate among population between the ages 25 and 29 in the United States with a correlation coefficient (R) of 0.348 and weighted average of 84.4%. Similarly, the statistical analysis conducted on geographies consisting of 92,105,545 people shows a slight positive correlation between the proportion of Immigrants from Somalia and labor force participation rate among population between the ages 25 and 29 in the United States with a correlation coefficient (R) of 0.071 and weighted average of 87.1%, a difference of 3.1%.
In Labor Force | Age 25-29 Correlation Summary
| Measurement | Immigrants from Israel | Immigrants from Somalia |
| Minimum | 60.3% | 67.6% |
| Maximum | 100.0% | 100.0% |
| Range | 39.7% | 32.4% |
| Mean | 84.7% | 87.0% |
| Median | 84.8% | 86.7% |
| Interquartile 25% (IQ1) | 79.5% | 84.4% |
| Interquartile 75% (IQ3) | 90.2% | 90.4% |
| Interquartile Range (IQR) | 10.7% | 5.9% |
| Standard Deviation (Sample) | 9.9% | 5.8% |
| Standard Deviation (Population) | 9.9% | 5.8% |
Similar Demographics by In Labor Force | Age 25-29
Demographics Similar to Immigrants from Israel by In Labor Force | Age 25-29
In terms of in labor force | age 25-29, the demographic groups most similar to Immigrants from Israel are Portuguese (84.4%, a difference of 0.010%), Immigrants from South Eastern Asia (84.4%, a difference of 0.010%), Tlingit-Haida (84.4%, a difference of 0.020%), Immigrants from Iraq (84.4%, a difference of 0.020%), and Immigrants from Germany (84.4%, a difference of 0.030%).
| Demographics | Rating | Rank | In Labor Force | Age 25-29 |
| Immigrants | Ukraine | 33.7 /100 | #188 | Fair 84.5% |
| Moroccans | 32.6 /100 | #189 | Fair 84.5% |
| Welsh | 31.1 /100 | #190 | Fair 84.5% |
| Zimbabweans | 28.7 /100 | #191 | Fair 84.5% |
| English | 25.8 /100 | #192 | Fair 84.5% |
| South American Indians | 25.0 /100 | #193 | Fair 84.5% |
| Portuguese | 21.2 /100 | #194 | Fair 84.4% |
| Immigrants | Israel | 20.8 /100 | #195 | Fair 84.4% |
| Immigrants | South Eastern Asia | 19.5 /100 | #196 | Poor 84.4% |
| Tlingit-Haida | 19.3 /100 | #197 | Poor 84.4% |
| Immigrants | Iraq | 19.0 /100 | #198 | Poor 84.4% |
| Immigrants | Germany | 18.3 /100 | #199 | Poor 84.4% |
| Immigrants | Kazakhstan | 17.5 /100 | #200 | Poor 84.4% |
| Laotians | 16.6 /100 | #201 | Poor 84.4% |
| Afghans | 15.9 /100 | #202 | Poor 84.4% |
Demographics Similar to Immigrants from Somalia by In Labor Force | Age 25-29
In terms of in labor force | age 25-29, the demographic groups most similar to Immigrants from Somalia are Somali (87.1%, a difference of 0.010%), Carpatho Rusyn (87.0%, a difference of 0.090%), Luxembourger (86.9%, a difference of 0.19%), Slovene (86.4%, a difference of 0.81%), and Immigrants from Bosnia and Herzegovina (86.3%, a difference of 0.93%).
| Demographics | Rating | Rank | In Labor Force | Age 25-29 |
| Tsimshian | 100.0 /100 | #1 | Exceptional 88.7% |
| Immigrants | Somalia | 100.0 /100 | #2 | Exceptional 87.1% |
| Somalis | 100.0 /100 | #3 | Exceptional 87.1% |
| Carpatho Rusyns | 100.0 /100 | #4 | Exceptional 87.0% |
| Luxembourgers | 100.0 /100 | #5 | Exceptional 86.9% |
| Slovenes | 100.0 /100 | #6 | Exceptional 86.4% |
| Immigrants | Bosnia and Herzegovina | 100.0 /100 | #7 | Exceptional 86.3% |
| Immigrants | Cabo Verde | 100.0 /100 | #8 | Exceptional 86.2% |
| Ethiopians | 100.0 /100 | #9 | Exceptional 86.2% |
| Liberians | 100.0 /100 | #10 | Exceptional 86.1% |
| Immigrants | Ethiopia | 100.0 /100 | #11 | Exceptional 86.1% |
| Immigrants | Lithuania | 100.0 /100 | #12 | Exceptional 86.1% |
| Norwegians | 100.0 /100 | #13 | Exceptional 86.1% |
| Latvians | 100.0 /100 | #14 | Exceptional 86.1% |
| Bolivians | 100.0 /100 | #15 | Exceptional 86.1% |