Immigrants from Israel vs Fijian In Labor Force | Age 16-19
COMPARE
Immigrants from Israel
Fijian
In Labor Force | Age 16-19
In Labor Force | Age 16-19 Comparison
Immigrants from Israel
Fijians
30.5%
IN LABOR FORCE | AGE 16-19
0.0/ 100
METRIC RATING
332nd/ 347
METRIC RANK
40.4%
IN LABOR FORCE | AGE 16-19
100.0/ 100
METRIC RATING
56th/ 347
METRIC RANK
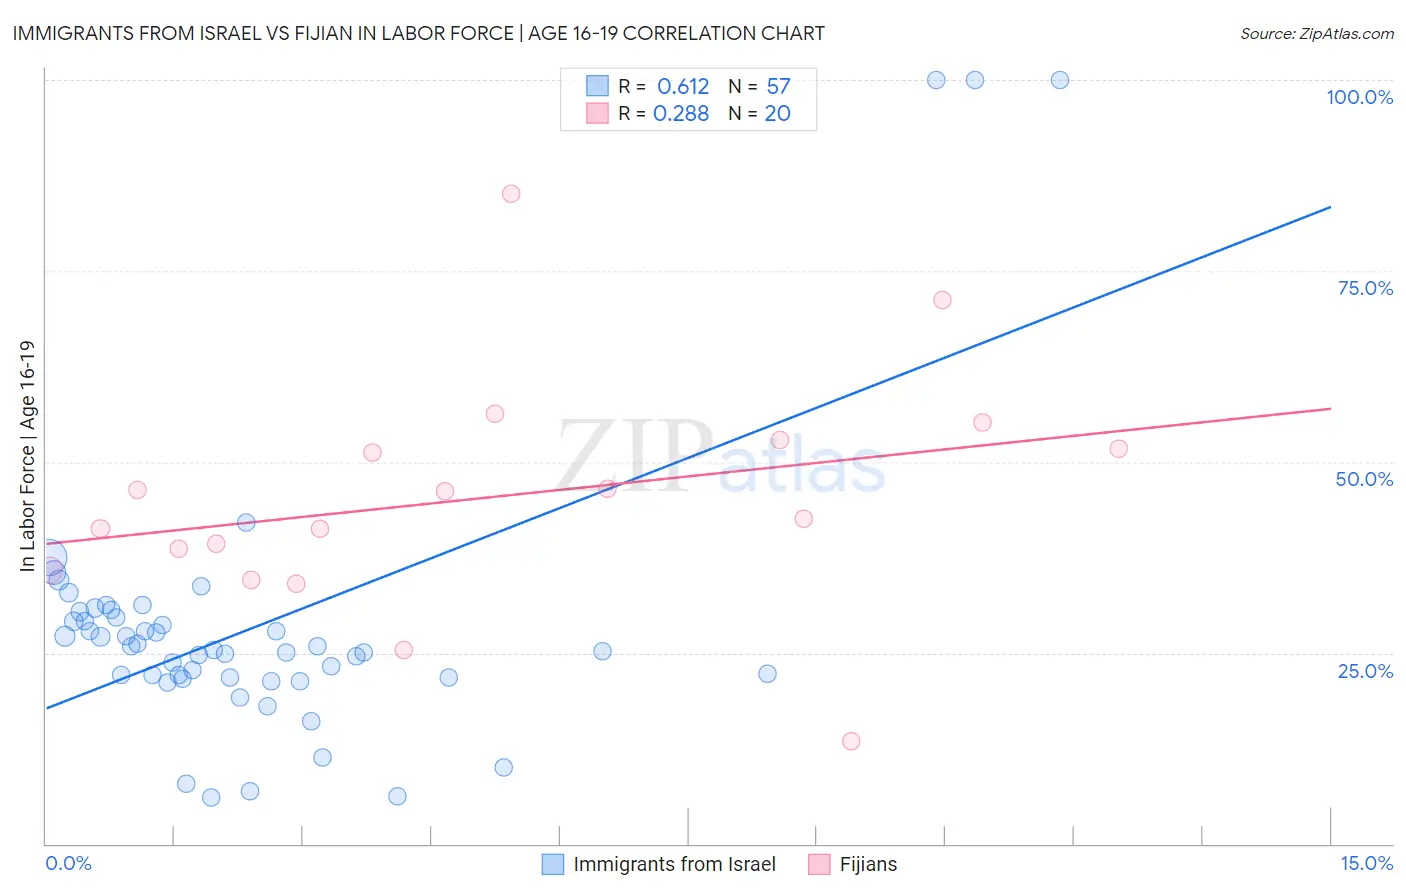
Immigrants from Israel vs Fijian In Labor Force | Age 16-19 Correlation Chart
The statistical analysis conducted on geographies consisting of 209,706,928 people shows a significant positive correlation between the proportion of Immigrants from Israel and labor force participation rate among population between the ages 16 and 19 in the United States with a correlation coefficient (R) of 0.612 and weighted average of 30.5%. Similarly, the statistical analysis conducted on geographies consisting of 55,922,250 people shows a weak positive correlation between the proportion of Fijians and labor force participation rate among population between the ages 16 and 19 in the United States with a correlation coefficient (R) of 0.288 and weighted average of 40.4%, a difference of 32.7%.
In Labor Force | Age 16-19 Correlation Summary
| Measurement | Immigrants from Israel | Fijian |
| Minimum | 6.1% | 13.4% |
| Maximum | 100.0% | 85.1% |
| Range | 93.9% | 71.7% |
| Mean | 28.4% | 45.4% |
| Median | 25.4% | 44.4% |
| Interquartile 25% (IQ1) | 21.8% | 37.2% |
| Interquartile 75% (IQ3) | 30.0% | 52.2% |
| Interquartile Range (IQR) | 8.2% | 15.0% |
| Standard Deviation (Sample) | 18.6% | 15.4% |
| Standard Deviation (Population) | 18.4% | 15.0% |
Similar Demographics by In Labor Force | Age 16-19
Demographics Similar to Immigrants from Israel by In Labor Force | Age 16-19
In terms of in labor force | age 16-19, the demographic groups most similar to Immigrants from Israel are Immigrants from Hong Kong (30.5%, a difference of 0.020%), Puerto Rican (30.3%, a difference of 0.44%), Immigrants from Cuba (30.2%, a difference of 0.77%), Immigrants from Trinidad and Tobago (30.2%, a difference of 1.1%), and Immigrants from Bangladesh (30.0%, a difference of 1.4%).
| Demographics | Rating | Rank | In Labor Force | Age 16-19 |
| Immigrants | China | 0.0 /100 | #325 | Tragic 31.1% |
| Immigrants | Dominican Republic | 0.0 /100 | #326 | Tragic 31.1% |
| Immigrants | Taiwan | 0.0 /100 | #327 | Tragic 31.0% |
| Immigrants | Ecuador | 0.0 /100 | #328 | Tragic 31.0% |
| Barbadians | 0.0 /100 | #329 | Tragic 31.0% |
| Lumbee | 0.0 /100 | #330 | Tragic 31.0% |
| Trinidadians and Tobagonians | 0.0 /100 | #331 | Tragic 30.9% |
| Immigrants | Israel | 0.0 /100 | #332 | Tragic 30.5% |
| Immigrants | Hong Kong | 0.0 /100 | #333 | Tragic 30.5% |
| Puerto Ricans | 0.0 /100 | #334 | Tragic 30.3% |
| Immigrants | Cuba | 0.0 /100 | #335 | Tragic 30.2% |
| Immigrants | Trinidad and Tobago | 0.0 /100 | #336 | Tragic 30.2% |
| Immigrants | Bangladesh | 0.0 /100 | #337 | Tragic 30.0% |
| Vietnamese | 0.0 /100 | #338 | Tragic 29.6% |
| Immigrants | Uzbekistan | 0.0 /100 | #339 | Tragic 29.2% |
Demographics Similar to Fijians by In Labor Force | Age 16-19
In terms of in labor force | age 16-19, the demographic groups most similar to Fijians are Lithuanian (40.4%, a difference of 0.030%), Aleut (40.4%, a difference of 0.040%), British (40.5%, a difference of 0.090%), Tlingit-Haida (40.5%, a difference of 0.12%), and Immigrants from Kenya (40.5%, a difference of 0.15%).
| Demographics | Rating | Rank | In Labor Force | Age 16-19 |
| Cree | 100.0 /100 | #49 | Exceptional 40.8% |
| Indonesians | 100.0 /100 | #50 | Exceptional 40.7% |
| Immigrants | Zaire | 100.0 /100 | #51 | Exceptional 40.7% |
| Immigrants | Laos | 100.0 /100 | #52 | Exceptional 40.6% |
| Immigrants | Kenya | 100.0 /100 | #53 | Exceptional 40.5% |
| Tlingit-Haida | 100.0 /100 | #54 | Exceptional 40.5% |
| British | 100.0 /100 | #55 | Exceptional 40.5% |
| Fijians | 100.0 /100 | #56 | Exceptional 40.4% |
| Lithuanians | 100.0 /100 | #57 | Exceptional 40.4% |
| Aleuts | 100.0 /100 | #58 | Exceptional 40.4% |
| Slavs | 100.0 /100 | #59 | Exceptional 40.4% |
| Immigrants | Eastern Africa | 100.0 /100 | #60 | Exceptional 40.4% |
| Americans | 100.0 /100 | #61 | Exceptional 40.3% |
| Cherokee | 100.0 /100 | #62 | Exceptional 40.2% |
| Northern Europeans | 100.0 /100 | #63 | Exceptional 40.2% |