Immigrants from Ireland vs Serbian In Labor Force | Age 25-29
COMPARE
Immigrants from Ireland
Serbian
In Labor Force | Age 25-29
In Labor Force | Age 25-29 Comparison
Immigrants from Ireland
Serbians
86.0%
IN LABOR FORCE | AGE 25-29
100.0/ 100
METRIC RATING
20th/ 347
METRIC RANK
85.5%
IN LABOR FORCE | AGE 25-29
99.5/ 100
METRIC RATING
61st/ 347
METRIC RANK
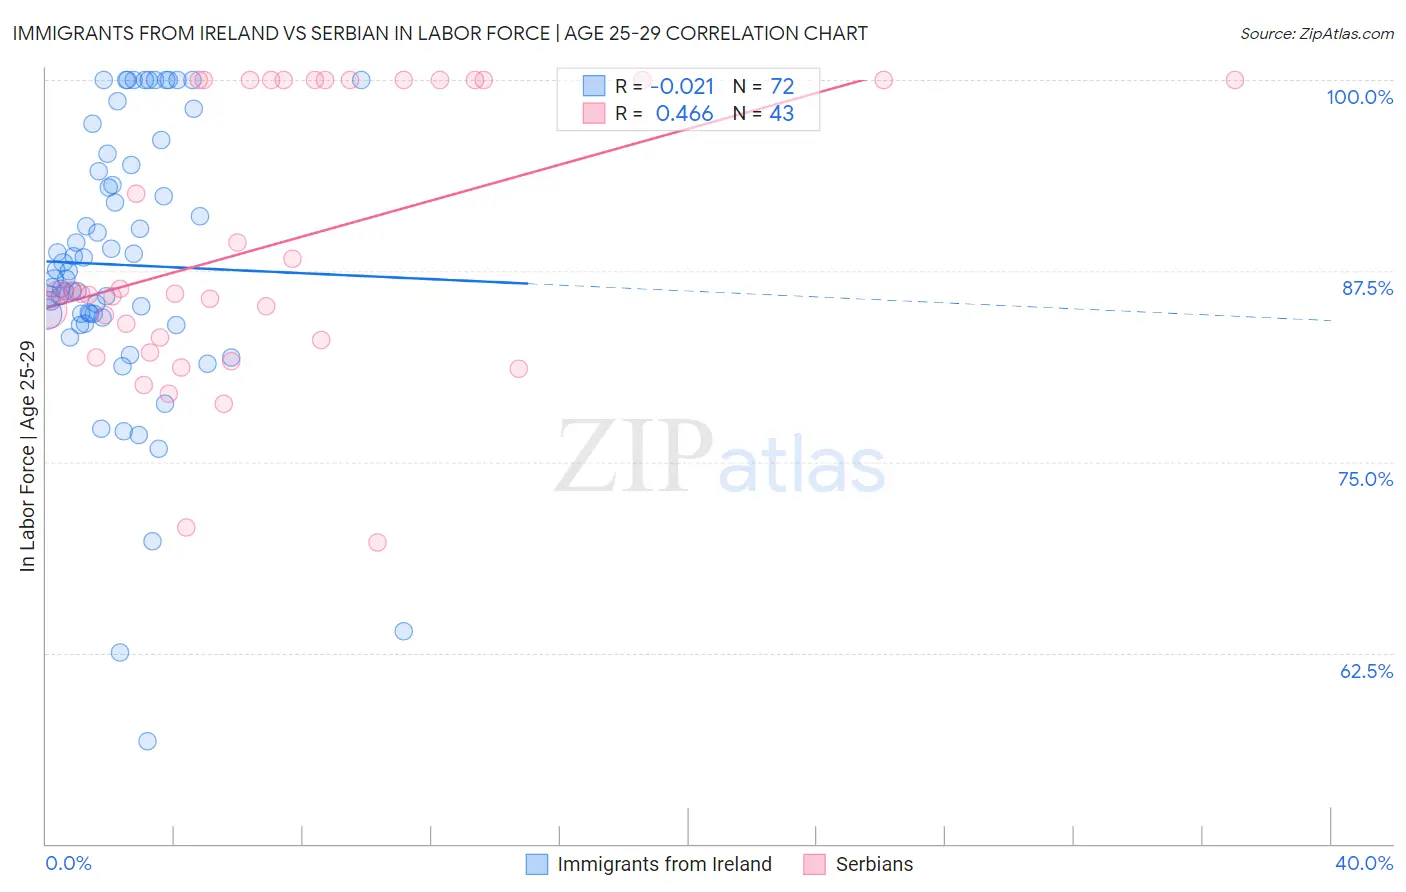
Immigrants from Ireland vs Serbian In Labor Force | Age 25-29 Correlation Chart
The statistical analysis conducted on geographies consisting of 240,731,363 people shows no correlation between the proportion of Immigrants from Ireland and labor force participation rate among population between the ages 25 and 29 in the United States with a correlation coefficient (R) of -0.021 and weighted average of 86.0%. Similarly, the statistical analysis conducted on geographies consisting of 267,583,292 people shows a moderate positive correlation between the proportion of Serbians and labor force participation rate among population between the ages 25 and 29 in the United States with a correlation coefficient (R) of 0.466 and weighted average of 85.5%, a difference of 0.63%.
In Labor Force | Age 25-29 Correlation Summary
| Measurement | Immigrants from Ireland | Serbian |
| Minimum | 56.7% | 69.7% |
| Maximum | 100.0% | 100.0% |
| Range | 43.3% | 30.3% |
| Mean | 87.9% | 89.2% |
| Median | 87.2% | 86.2% |
| Interquartile 25% (IQ1) | 84.6% | 83.0% |
| Interquartile 75% (IQ3) | 94.2% | 100.0% |
| Interquartile Range (IQR) | 9.7% | 17.0% |
| Standard Deviation (Sample) | 9.1% | 8.9% |
| Standard Deviation (Population) | 9.0% | 8.8% |
Similar Demographics by In Labor Force | Age 25-29
Demographics Similar to Immigrants from Ireland by In Labor Force | Age 25-29
In terms of in labor force | age 25-29, the demographic groups most similar to Immigrants from Ireland are Cape Verdean (86.0%, a difference of 0.010%), Maltese (86.0%, a difference of 0.010%), Bulgarian (86.0%, a difference of 0.020%), Cambodian (86.0%, a difference of 0.020%), and Immigrants from Uganda (86.0%, a difference of 0.040%).
| Demographics | Rating | Rank | In Labor Force | Age 25-29 |
| Norwegians | 100.0 /100 | #13 | Exceptional 86.1% |
| Latvians | 100.0 /100 | #14 | Exceptional 86.1% |
| Bolivians | 100.0 /100 | #15 | Exceptional 86.1% |
| Immigrants | Bolivia | 100.0 /100 | #16 | Exceptional 86.1% |
| Bermudans | 100.0 /100 | #17 | Exceptional 86.0% |
| Bulgarians | 100.0 /100 | #18 | Exceptional 86.0% |
| Cape Verdeans | 100.0 /100 | #19 | Exceptional 86.0% |
| Immigrants | Ireland | 100.0 /100 | #20 | Exceptional 86.0% |
| Maltese | 100.0 /100 | #21 | Exceptional 86.0% |
| Cambodians | 100.0 /100 | #22 | Exceptional 86.0% |
| Immigrants | Uganda | 100.0 /100 | #23 | Exceptional 86.0% |
| Immigrants | Eastern Africa | 100.0 /100 | #24 | Exceptional 86.0% |
| Sudanese | 100.0 /100 | #25 | Exceptional 85.9% |
| Immigrants | North Macedonia | 100.0 /100 | #26 | Exceptional 85.9% |
| Paraguayans | 100.0 /100 | #27 | Exceptional 85.9% |
Demographics Similar to Serbians by In Labor Force | Age 25-29
In terms of in labor force | age 25-29, the demographic groups most similar to Serbians are Thai (85.5%, a difference of 0.0%), Taiwanese (85.4%, a difference of 0.020%), Immigrants from Kenya (85.4%, a difference of 0.020%), Immigrants from Morocco (85.5%, a difference of 0.030%), and Estonian (85.5%, a difference of 0.040%).
| Demographics | Rating | Rank | In Labor Force | Age 25-29 |
| Albanians | 99.7 /100 | #54 | Exceptional 85.5% |
| Immigrants | Brazil | 99.7 /100 | #55 | Exceptional 85.5% |
| Eastern Europeans | 99.6 /100 | #56 | Exceptional 85.5% |
| Estonians | 99.6 /100 | #57 | Exceptional 85.5% |
| Greeks | 99.6 /100 | #58 | Exceptional 85.5% |
| Immigrants | Morocco | 99.5 /100 | #59 | Exceptional 85.5% |
| Thais | 99.5 /100 | #60 | Exceptional 85.5% |
| Serbians | 99.5 /100 | #61 | Exceptional 85.5% |
| Taiwanese | 99.4 /100 | #62 | Exceptional 85.4% |
| Immigrants | Kenya | 99.4 /100 | #63 | Exceptional 85.4% |
| Immigrants | Italy | 99.3 /100 | #64 | Exceptional 85.4% |
| Immigrants | Czechoslovakia | 99.3 /100 | #65 | Exceptional 85.4% |
| Immigrants | Scotland | 99.3 /100 | #66 | Exceptional 85.4% |
| Immigrants | Turkey | 99.2 /100 | #67 | Exceptional 85.4% |
| Immigrants | Cameroon | 99.2 /100 | #68 | Exceptional 85.4% |