Immigrants from Hungary vs Immigrants from Bahamas In Labor Force | Age 25-29
COMPARE
Immigrants from Hungary
Immigrants from Bahamas
In Labor Force | Age 25-29
In Labor Force | Age 25-29 Comparison
Immigrants from Hungary
Immigrants from Bahamas
84.8%
IN LABOR FORCE | AGE 25-29
76.4/ 100
METRIC RATING
135th/ 347
METRIC RANK
83.6%
IN LABOR FORCE | AGE 25-29
0.1/ 100
METRIC RATING
260th/ 347
METRIC RANK
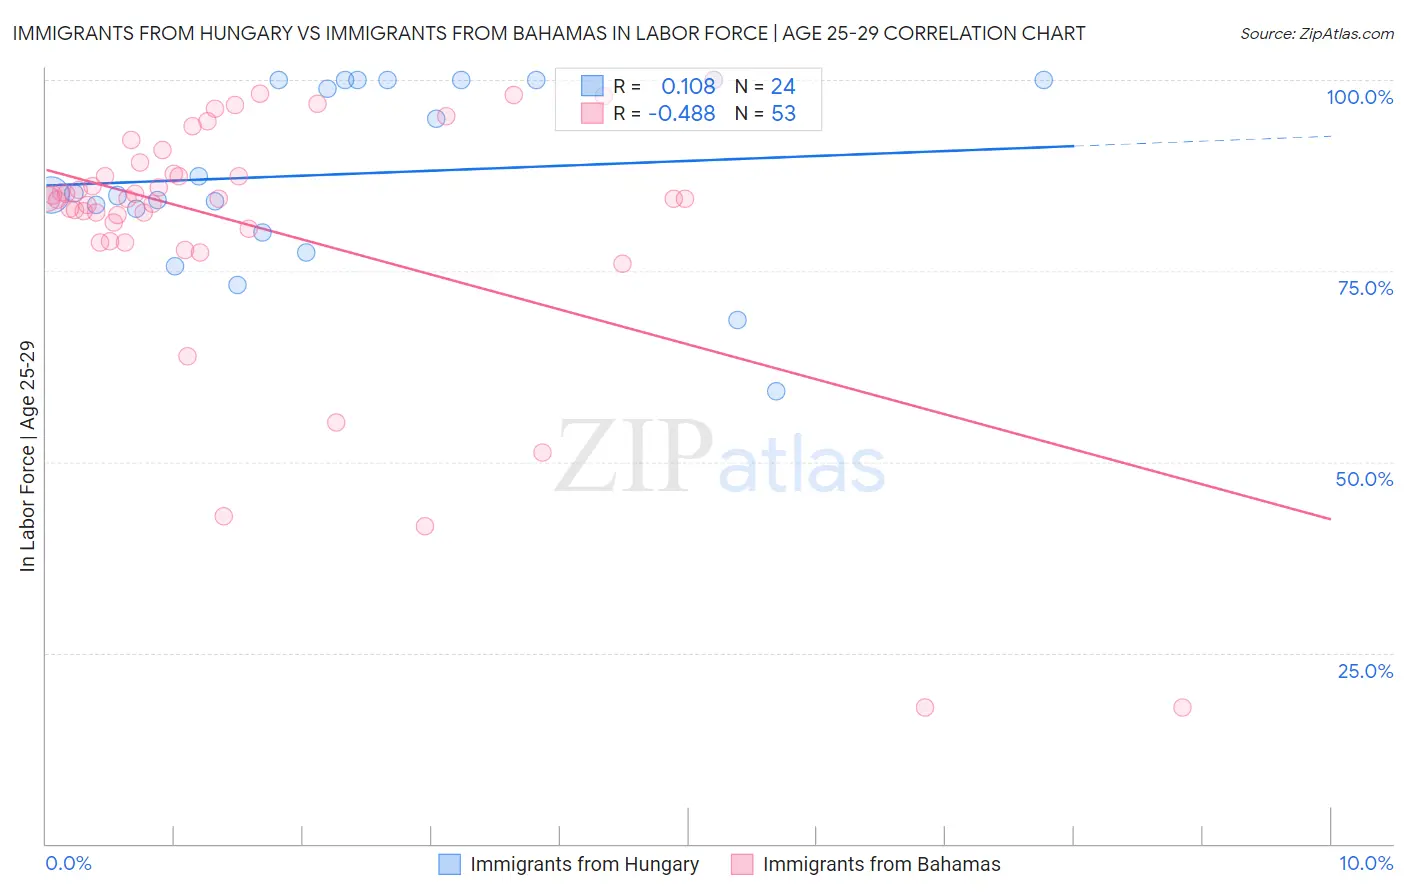
Immigrants from Hungary vs Immigrants from Bahamas In Labor Force | Age 25-29 Correlation Chart
The statistical analysis conducted on geographies consisting of 195,638,068 people shows a poor positive correlation between the proportion of Immigrants from Hungary and labor force participation rate among population between the ages 25 and 29 in the United States with a correlation coefficient (R) of 0.108 and weighted average of 84.8%. Similarly, the statistical analysis conducted on geographies consisting of 104,655,808 people shows a moderate negative correlation between the proportion of Immigrants from Bahamas and labor force participation rate among population between the ages 25 and 29 in the United States with a correlation coefficient (R) of -0.488 and weighted average of 83.6%, a difference of 1.5%.
In Labor Force | Age 25-29 Correlation Summary
| Measurement | Immigrants from Hungary | Immigrants from Bahamas |
| Minimum | 59.2% | 17.9% |
| Maximum | 100.0% | 100.0% |
| Range | 40.8% | 82.1% |
| Mean | 87.7% | 80.7% |
| Median | 85.1% | 84.4% |
| Interquartile 25% (IQ1) | 81.6% | 79.7% |
| Interquartile 75% (IQ3) | 100.0% | 88.5% |
| Interquartile Range (IQR) | 18.4% | 8.8% |
| Standard Deviation (Sample) | 11.7% | 17.6% |
| Standard Deviation (Population) | 11.5% | 17.4% |
Similar Demographics by In Labor Force | Age 25-29
Demographics Similar to Immigrants from Hungary by In Labor Force | Age 25-29
In terms of in labor force | age 25-29, the demographic groups most similar to Immigrants from Hungary are Syrian (84.8%, a difference of 0.0%), Bhutanese (84.8%, a difference of 0.0%), Romanian (84.8%, a difference of 0.010%), Asian (84.8%, a difference of 0.010%), and Iranian (84.8%, a difference of 0.020%).
| Demographics | Rating | Rank | In Labor Force | Age 25-29 |
| Australians | 83.6 /100 | #128 | Excellent 84.9% |
| Immigrants | Russia | 81.6 /100 | #129 | Excellent 84.9% |
| Northern Europeans | 81.3 /100 | #130 | Excellent 84.9% |
| Iranians | 78.1 /100 | #131 | Good 84.8% |
| Romanians | 77.7 /100 | #132 | Good 84.8% |
| Asians | 77.7 /100 | #133 | Good 84.8% |
| Syrians | 76.5 /100 | #134 | Good 84.8% |
| Immigrants | Hungary | 76.4 /100 | #135 | Good 84.8% |
| Bhutanese | 76.0 /100 | #136 | Good 84.8% |
| Immigrants | Canada | 73.5 /100 | #137 | Good 84.8% |
| Armenians | 72.7 /100 | #138 | Good 84.8% |
| Immigrants | Eastern Asia | 72.6 /100 | #139 | Good 84.8% |
| Immigrants | North America | 72.1 /100 | #140 | Good 84.8% |
| Danes | 71.9 /100 | #141 | Good 84.8% |
| Pakistanis | 70.0 /100 | #142 | Good 84.8% |
Demographics Similar to Immigrants from Bahamas by In Labor Force | Age 25-29
In terms of in labor force | age 25-29, the demographic groups most similar to Immigrants from Bahamas are Pennsylvania German (83.6%, a difference of 0.0%), Spanish (83.6%, a difference of 0.010%), Immigrants from Guatemala (83.6%, a difference of 0.020%), Immigrants from Haiti (83.7%, a difference of 0.060%), and Delaware (83.7%, a difference of 0.060%).
| Demographics | Rating | Rank | In Labor Force | Age 25-29 |
| Immigrants | Trinidad and Tobago | 0.2 /100 | #253 | Tragic 83.7% |
| Spaniards | 0.2 /100 | #254 | Tragic 83.7% |
| Haitians | 0.2 /100 | #255 | Tragic 83.7% |
| Immigrants | Haiti | 0.2 /100 | #256 | Tragic 83.7% |
| Delaware | 0.2 /100 | #257 | Tragic 83.7% |
| Immigrants | Guatemala | 0.1 /100 | #258 | Tragic 83.6% |
| Spanish | 0.1 /100 | #259 | Tragic 83.6% |
| Immigrants | Bahamas | 0.1 /100 | #260 | Tragic 83.6% |
| Pennsylvania Germans | 0.1 /100 | #261 | Tragic 83.6% |
| Immigrants | Fiji | 0.1 /100 | #262 | Tragic 83.6% |
| West Indians | 0.1 /100 | #263 | Tragic 83.5% |
| Puget Sound Salish | 0.1 /100 | #264 | Tragic 83.5% |
| Cubans | 0.1 /100 | #265 | Tragic 83.5% |
| Aleuts | 0.0 /100 | #266 | Tragic 83.4% |
| Spanish Americans | 0.0 /100 | #267 | Tragic 83.4% |