Immigrants from Haiti vs Tongan In Labor Force | Age 16-19
COMPARE
Immigrants from Haiti
Tongan
In Labor Force | Age 16-19
In Labor Force | Age 16-19 Comparison
Immigrants from Haiti
Tongans
33.2%
IN LABOR FORCE | AGE 16-19
0.1/ 100
METRIC RATING
297th/ 347
METRIC RANK
41.2%
IN LABOR FORCE | AGE 16-19
100.0/ 100
METRIC RATING
43rd/ 347
METRIC RANK
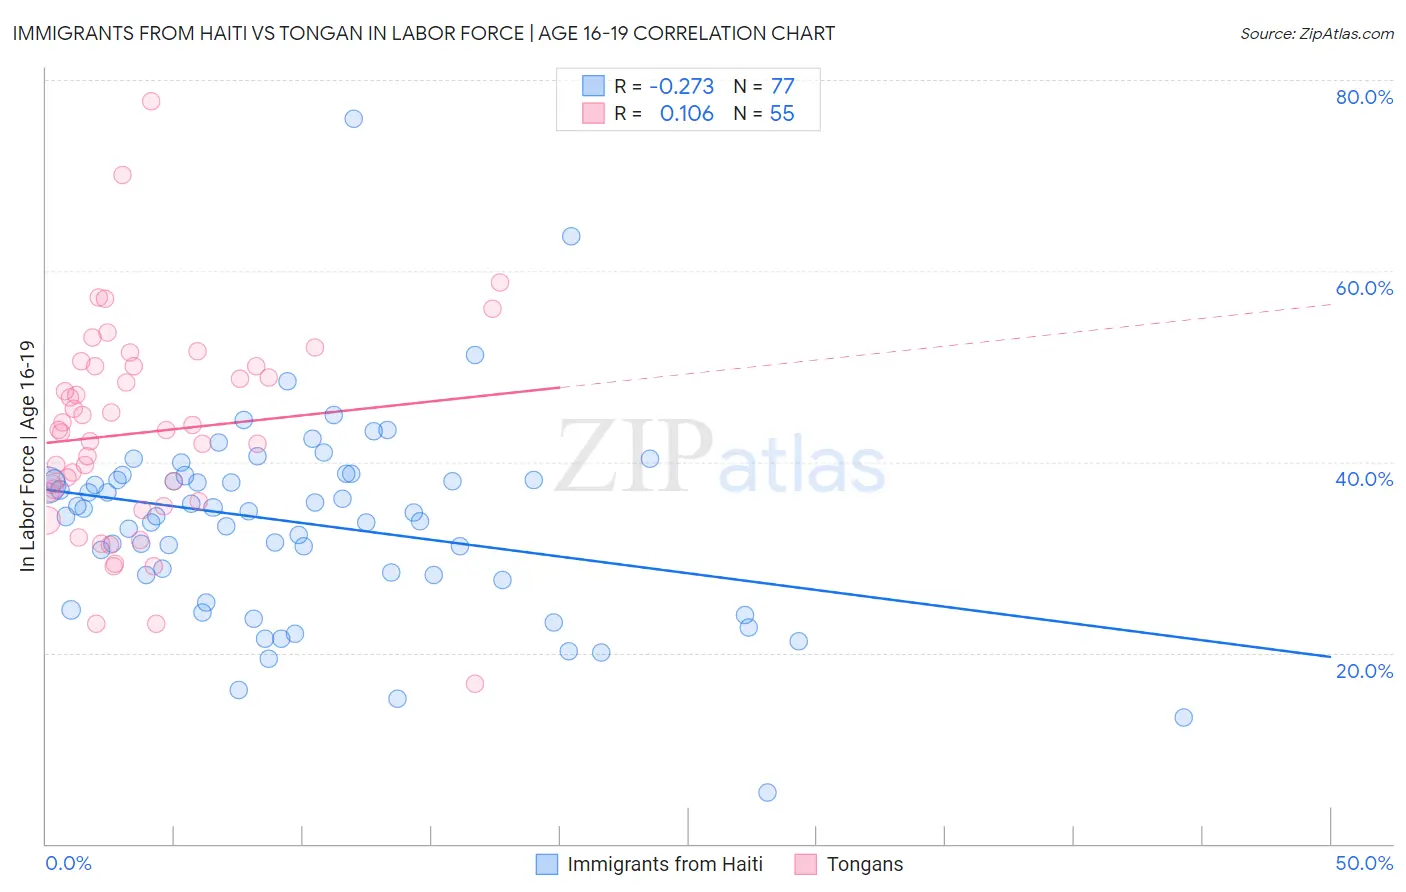
Immigrants from Haiti vs Tongan In Labor Force | Age 16-19 Correlation Chart
The statistical analysis conducted on geographies consisting of 225,034,404 people shows a weak negative correlation between the proportion of Immigrants from Haiti and labor force participation rate among population between the ages 16 and 19 in the United States with a correlation coefficient (R) of -0.273 and weighted average of 33.2%. Similarly, the statistical analysis conducted on geographies consisting of 102,873,941 people shows a poor positive correlation between the proportion of Tongans and labor force participation rate among population between the ages 16 and 19 in the United States with a correlation coefficient (R) of 0.106 and weighted average of 41.2%, a difference of 24.1%.
In Labor Force | Age 16-19 Correlation Summary
| Measurement | Immigrants from Haiti | Tongan |
| Minimum | 5.3% | 16.7% |
| Maximum | 76.0% | 77.7% |
| Range | 70.7% | 61.0% |
| Mean | 33.5% | 43.1% |
| Median | 34.6% | 43.3% |
| Interquartile 25% (IQ1) | 27.9% | 35.9% |
| Interquartile 75% (IQ3) | 38.3% | 50.0% |
| Interquartile Range (IQR) | 10.5% | 14.1% |
| Standard Deviation (Sample) | 10.4% | 11.1% |
| Standard Deviation (Population) | 10.3% | 11.0% |
Similar Demographics by In Labor Force | Age 16-19
Demographics Similar to Immigrants from Haiti by In Labor Force | Age 16-19
In terms of in labor force | age 16-19, the demographic groups most similar to Immigrants from Haiti are Jamaican (33.2%, a difference of 0.090%), Yup'ik (33.3%, a difference of 0.22%), Argentinean (33.3%, a difference of 0.33%), Immigrants from South America (33.3%, a difference of 0.34%), and Iranian (33.0%, a difference of 0.51%).
| Demographics | Rating | Rank | In Labor Force | Age 16-19 |
| Immigrants | Colombia | 0.1 /100 | #290 | Tragic 33.5% |
| Immigrants | Belarus | 0.1 /100 | #291 | Tragic 33.4% |
| Haitians | 0.1 /100 | #292 | Tragic 33.4% |
| Immigrants | South America | 0.1 /100 | #293 | Tragic 33.3% |
| Argentineans | 0.1 /100 | #294 | Tragic 33.3% |
| Yup'ik | 0.1 /100 | #295 | Tragic 33.3% |
| Jamaicans | 0.1 /100 | #296 | Tragic 33.2% |
| Immigrants | Haiti | 0.1 /100 | #297 | Tragic 33.2% |
| Iranians | 0.0 /100 | #298 | Tragic 33.0% |
| Armenians | 0.0 /100 | #299 | Tragic 32.9% |
| Immigrants | Argentina | 0.0 /100 | #300 | Tragic 32.9% |
| Okinawans | 0.0 /100 | #301 | Tragic 32.8% |
| Belizeans | 0.0 /100 | #302 | Tragic 32.8% |
| Immigrants | Dominica | 0.0 /100 | #303 | Tragic 32.5% |
| Israelis | 0.0 /100 | #304 | Tragic 32.4% |
Demographics Similar to Tongans by In Labor Force | Age 16-19
In terms of in labor force | age 16-19, the demographic groups most similar to Tongans are European (41.1%, a difference of 0.10%), Croatian (41.1%, a difference of 0.14%), White/Caucasian (41.3%, a difference of 0.30%), Celtic (41.3%, a difference of 0.31%), and Immigrants from Sudan (41.0%, a difference of 0.46%).
| Demographics | Rating | Rank | In Labor Force | Age 16-19 |
| Immigrants | Azores | 100.0 /100 | #36 | Exceptional 41.7% |
| Immigrants | Congo | 100.0 /100 | #37 | Exceptional 41.7% |
| Sioux | 100.0 /100 | #38 | Exceptional 41.5% |
| Scotch-Irish | 100.0 /100 | #39 | Exceptional 41.5% |
| Immigrants | Liberia | 100.0 /100 | #40 | Exceptional 41.5% |
| Celtics | 100.0 /100 | #41 | Exceptional 41.3% |
| Whites/Caucasians | 100.0 /100 | #42 | Exceptional 41.3% |
| Tongans | 100.0 /100 | #43 | Exceptional 41.2% |
| Europeans | 100.0 /100 | #44 | Exceptional 41.1% |
| Croatians | 100.0 /100 | #45 | Exceptional 41.1% |
| Immigrants | Sudan | 100.0 /100 | #46 | Exceptional 41.0% |
| Carpatho Rusyns | 100.0 /100 | #47 | Exceptional 40.8% |
| Icelanders | 100.0 /100 | #48 | Exceptional 40.8% |
| Cree | 100.0 /100 | #49 | Exceptional 40.8% |
| Indonesians | 100.0 /100 | #50 | Exceptional 40.7% |