Immigrants from Grenada vs Immigrants from Italy In Labor Force | Age 35-44
COMPARE
Immigrants from Grenada
Immigrants from Italy
In Labor Force | Age 35-44
In Labor Force | Age 35-44 Comparison
Immigrants from Grenada
Immigrants from Italy
83.3%
IN LABOR FORCE | AGE 35-44
0.1/ 100
METRIC RATING
269th/ 347
METRIC RANK
85.0%
IN LABOR FORCE | AGE 35-44
99.1/ 100
METRIC RATING
67th/ 347
METRIC RANK
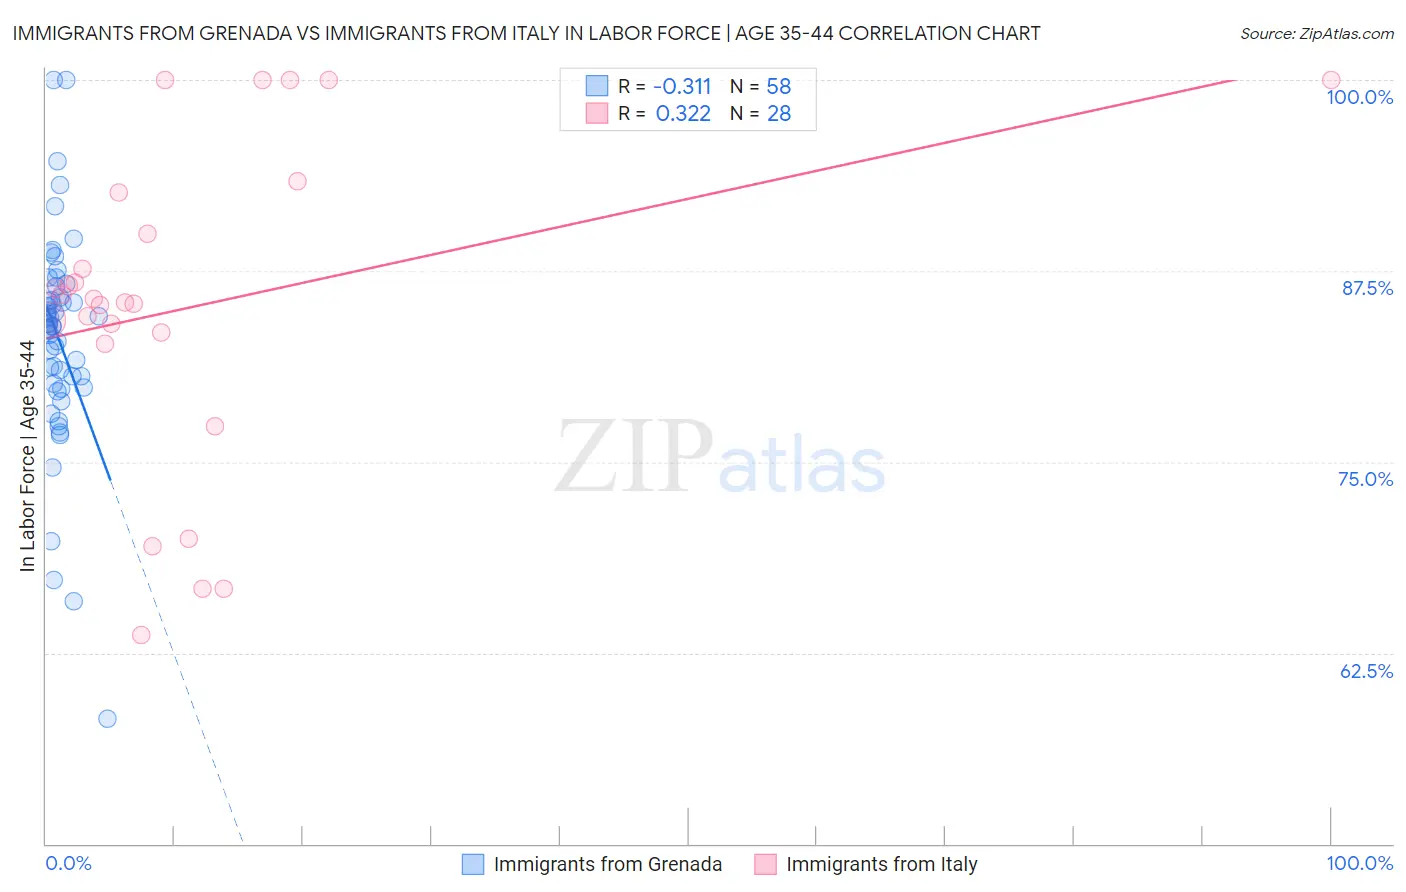
Immigrants from Grenada vs Immigrants from Italy In Labor Force | Age 35-44 Correlation Chart
The statistical analysis conducted on geographies consisting of 67,194,907 people shows a mild negative correlation between the proportion of Immigrants from Grenada and labor force participation rate among population between the ages 35 and 44 in the United States with a correlation coefficient (R) of -0.311 and weighted average of 83.3%. Similarly, the statistical analysis conducted on geographies consisting of 324,156,768 people shows a mild positive correlation between the proportion of Immigrants from Italy and labor force participation rate among population between the ages 35 and 44 in the United States with a correlation coefficient (R) of 0.322 and weighted average of 85.0%, a difference of 2.0%.
In Labor Force | Age 35-44 Correlation Summary
| Measurement | Immigrants from Grenada | Immigrants from Italy |
| Minimum | 58.2% | 63.7% |
| Maximum | 100.0% | 100.0% |
| Range | 41.8% | 36.3% |
| Mean | 83.1% | 85.1% |
| Median | 84.0% | 85.6% |
| Interquartile 25% (IQ1) | 80.1% | 83.1% |
| Interquartile 75% (IQ3) | 85.8% | 91.2% |
| Interquartile Range (IQR) | 5.7% | 8.1% |
| Standard Deviation (Sample) | 7.0% | 10.5% |
| Standard Deviation (Population) | 7.0% | 10.3% |
Similar Demographics by In Labor Force | Age 35-44
Demographics Similar to Immigrants from Grenada by In Labor Force | Age 35-44
In terms of in labor force | age 35-44, the demographic groups most similar to Immigrants from Grenada are Honduran (83.4%, a difference of 0.010%), Guamanian/Chamorro (83.4%, a difference of 0.040%), Spaniard (83.4%, a difference of 0.090%), Immigrants from Honduras (83.3%, a difference of 0.12%), and French American Indian (83.2%, a difference of 0.12%).
| Demographics | Rating | Rank | In Labor Force | Age 35-44 |
| Immigrants | Congo | 0.2 /100 | #262 | Tragic 83.5% |
| Iroquois | 0.2 /100 | #263 | Tragic 83.5% |
| Scotch-Irish | 0.1 /100 | #264 | Tragic 83.5% |
| Central Americans | 0.1 /100 | #265 | Tragic 83.5% |
| Spaniards | 0.1 /100 | #266 | Tragic 83.4% |
| Guamanians/Chamorros | 0.1 /100 | #267 | Tragic 83.4% |
| Hondurans | 0.1 /100 | #268 | Tragic 83.4% |
| Immigrants | Grenada | 0.1 /100 | #269 | Tragic 83.3% |
| Immigrants | Honduras | 0.0 /100 | #270 | Tragic 83.3% |
| French American Indians | 0.0 /100 | #271 | Tragic 83.2% |
| Immigrants | Fiji | 0.0 /100 | #272 | Tragic 83.2% |
| Spanish | 0.0 /100 | #273 | Tragic 83.2% |
| Immigrants | Nonimmigrants | 0.0 /100 | #274 | Tragic 83.2% |
| Hawaiians | 0.0 /100 | #275 | Tragic 83.2% |
| Delaware | 0.0 /100 | #276 | Tragic 83.2% |
Demographics Similar to Immigrants from Italy by In Labor Force | Age 35-44
In terms of in labor force | age 35-44, the demographic groups most similar to Immigrants from Italy are Italian (85.0%, a difference of 0.0%), Immigrants from Brazil (85.0%, a difference of 0.010%), Immigrants from Haiti (85.0%, a difference of 0.010%), Sudanese (85.0%, a difference of 0.010%), and Swedish (85.0%, a difference of 0.020%).
| Demographics | Rating | Rank | In Labor Force | Age 35-44 |
| Albanians | 99.4 /100 | #60 | Exceptional 85.1% |
| Immigrants | Latvia | 99.3 /100 | #61 | Exceptional 85.0% |
| Immigrants | Moldova | 99.3 /100 | #62 | Exceptional 85.0% |
| Immigrants | Uganda | 99.3 /100 | #63 | Exceptional 85.0% |
| Swedes | 99.2 /100 | #64 | Exceptional 85.0% |
| Immigrants | Brazil | 99.2 /100 | #65 | Exceptional 85.0% |
| Immigrants | Haiti | 99.1 /100 | #66 | Exceptional 85.0% |
| Immigrants | Italy | 99.1 /100 | #67 | Exceptional 85.0% |
| Italians | 99.1 /100 | #68 | Exceptional 85.0% |
| Sudanese | 99.0 /100 | #69 | Exceptional 85.0% |
| Brazilians | 99.0 /100 | #70 | Exceptional 85.0% |
| Russians | 99.0 /100 | #71 | Exceptional 85.0% |
| Immigrants | Singapore | 98.9 /100 | #72 | Exceptional 85.0% |
| Immigrants | Sri Lanka | 98.9 /100 | #73 | Exceptional 85.0% |
| Colombians | 98.8 /100 | #74 | Exceptional 85.0% |