Immigrants from Czechoslovakia vs Salvadoran In Labor Force | Age 16-19
COMPARE
Immigrants from Czechoslovakia
Salvadoran
In Labor Force | Age 16-19
In Labor Force | Age 16-19 Comparison
Immigrants from Czechoslovakia
Salvadorans
36.6%
IN LABOR FORCE | AGE 16-19
50.0/ 100
METRIC RATING
174th/ 347
METRIC RANK
34.5%
IN LABOR FORCE | AGE 16-19
1.1/ 100
METRIC RATING
261st/ 347
METRIC RANK
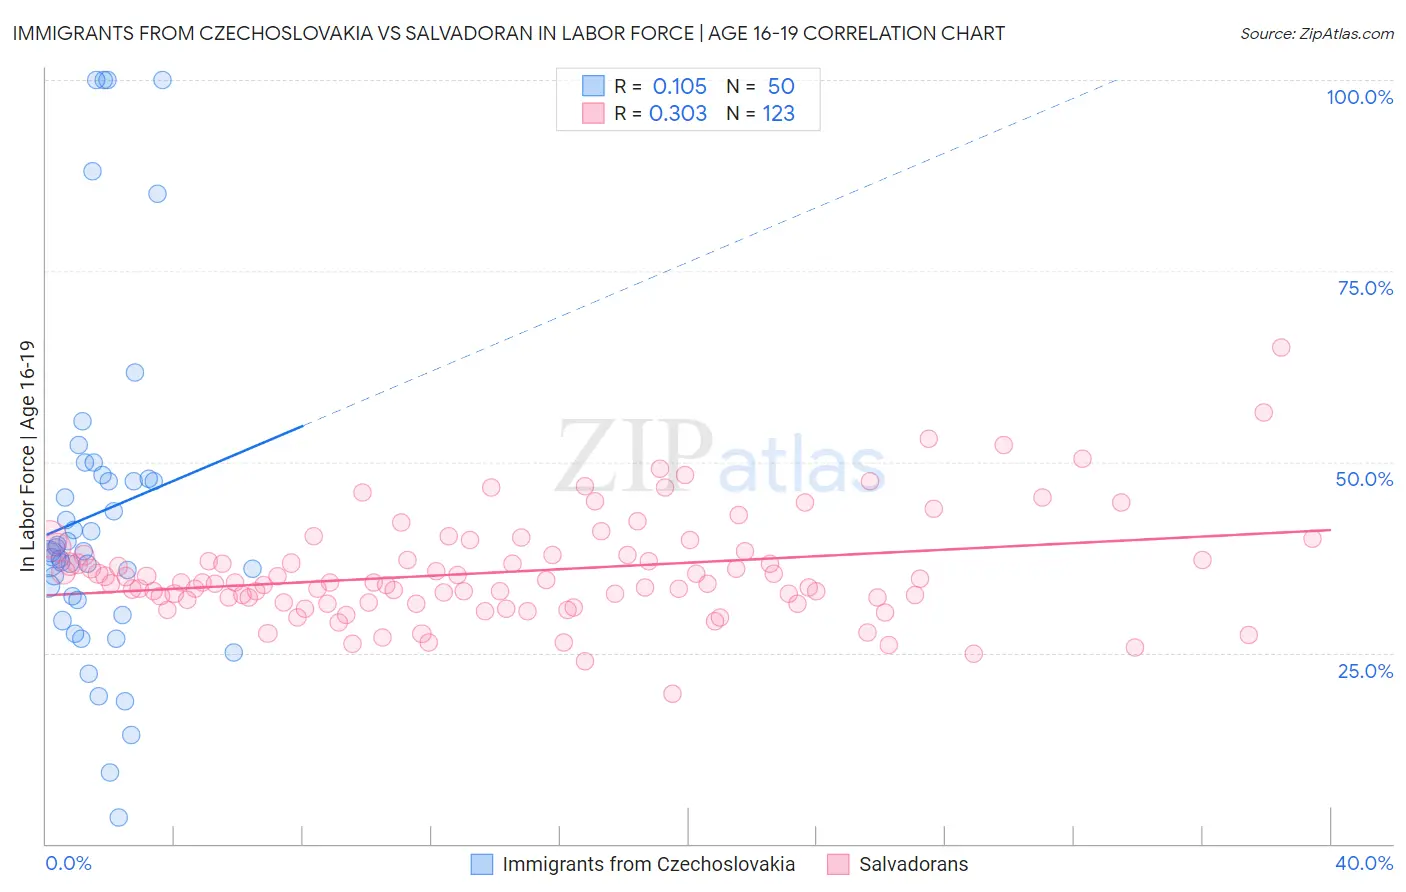
Immigrants from Czechoslovakia vs Salvadoran In Labor Force | Age 16-19 Correlation Chart
The statistical analysis conducted on geographies consisting of 195,231,062 people shows a poor positive correlation between the proportion of Immigrants from Czechoslovakia and labor force participation rate among population between the ages 16 and 19 in the United States with a correlation coefficient (R) of 0.105 and weighted average of 36.6%. Similarly, the statistical analysis conducted on geographies consisting of 398,452,948 people shows a mild positive correlation between the proportion of Salvadorans and labor force participation rate among population between the ages 16 and 19 in the United States with a correlation coefficient (R) of 0.303 and weighted average of 34.5%, a difference of 6.0%.
In Labor Force | Age 16-19 Correlation Summary
| Measurement | Immigrants from Czechoslovakia | Salvadoran |
| Minimum | 3.5% | 19.7% |
| Maximum | 100.0% | 65.0% |
| Range | 96.5% | 45.3% |
| Mean | 43.4% | 35.6% |
| Median | 38.2% | 34.2% |
| Interquartile 25% (IQ1) | 31.9% | 31.6% |
| Interquartile 75% (IQ3) | 47.8% | 37.9% |
| Interquartile Range (IQR) | 15.9% | 6.3% |
| Standard Deviation (Sample) | 22.6% | 6.9% |
| Standard Deviation (Population) | 22.3% | 6.9% |
Similar Demographics by In Labor Force | Age 16-19
Demographics Similar to Immigrants from Czechoslovakia by In Labor Force | Age 16-19
In terms of in labor force | age 16-19, the demographic groups most similar to Immigrants from Czechoslovakia are Native/Alaskan (36.6%, a difference of 0.050%), Albanian (36.5%, a difference of 0.060%), Immigrants from Northern Europe (36.5%, a difference of 0.17%), Black/African American (36.5%, a difference of 0.25%), and Immigrants from Southern Europe (36.4%, a difference of 0.34%).
| Demographics | Rating | Rank | In Labor Force | Age 16-19 |
| Arabs | 63.6 /100 | #167 | Good 36.8% |
| Palestinians | 63.1 /100 | #168 | Good 36.8% |
| Immigrants | Latvia | 61.6 /100 | #169 | Good 36.8% |
| Immigrants | South Africa | 60.5 /100 | #170 | Good 36.8% |
| Immigrants | Cambodia | 58.4 /100 | #171 | Average 36.7% |
| South Africans | 58.3 /100 | #172 | Average 36.7% |
| Russians | 57.5 /100 | #173 | Average 36.7% |
| Immigrants | Czechoslovakia | 50.0 /100 | #174 | Average 36.6% |
| Natives/Alaskans | 49.0 /100 | #175 | Average 36.6% |
| Albanians | 48.8 /100 | #176 | Average 36.5% |
| Immigrants | Northern Europe | 46.6 /100 | #177 | Average 36.5% |
| Blacks/African Americans | 45.1 /100 | #178 | Average 36.5% |
| Immigrants | Southern Europe | 43.3 /100 | #179 | Average 36.4% |
| Immigrants | Morocco | 41.1 /100 | #180 | Average 36.4% |
| Jordanians | 39.6 /100 | #181 | Fair 36.4% |
Demographics Similar to Salvadorans by In Labor Force | Age 16-19
In terms of in labor force | age 16-19, the demographic groups most similar to Salvadorans are Hispanic or Latino (34.5%, a difference of 0.010%), Egyptian (34.5%, a difference of 0.040%), Burmese (34.5%, a difference of 0.050%), Immigrants (34.6%, a difference of 0.12%), and Immigrants from Egypt (34.6%, a difference of 0.14%).
| Demographics | Rating | Rank | In Labor Force | Age 16-19 |
| Bahamians | 1.4 /100 | #254 | Tragic 34.6% |
| Peruvians | 1.4 /100 | #255 | Tragic 34.6% |
| Immigrants | South Central Asia | 1.3 /100 | #256 | Tragic 34.6% |
| Immigrants | Egypt | 1.2 /100 | #257 | Tragic 34.6% |
| Thais | 1.2 /100 | #258 | Tragic 34.6% |
| Immigrants | Immigrants | 1.2 /100 | #259 | Tragic 34.6% |
| Egyptians | 1.2 /100 | #260 | Tragic 34.5% |
| Salvadorans | 1.1 /100 | #261 | Tragic 34.5% |
| Hispanics or Latinos | 1.1 /100 | #262 | Tragic 34.5% |
| Burmese | 1.1 /100 | #263 | Tragic 34.5% |
| Immigrants | Uruguay | 0.9 /100 | #264 | Tragic 34.4% |
| Immigrants | El Salvador | 0.7 /100 | #265 | Tragic 34.3% |
| Immigrants | Malaysia | 0.7 /100 | #266 | Tragic 34.3% |
| Immigrants | Peru | 0.5 /100 | #267 | Tragic 34.2% |
| Immigrants | Asia | 0.5 /100 | #268 | Tragic 34.1% |