Immigrants from Croatia vs Peruvian In Labor Force | Age 45-54
COMPARE
Immigrants from Croatia
Peruvian
In Labor Force | Age 45-54
In Labor Force | Age 45-54 Comparison
Immigrants from Croatia
Peruvians
83.4%
IN LABOR FORCE | AGE 45-54
96.5/ 100
METRIC RATING
80th/ 347
METRIC RANK
83.6%
IN LABOR FORCE | AGE 45-54
98.7/ 100
METRIC RATING
53rd/ 347
METRIC RANK
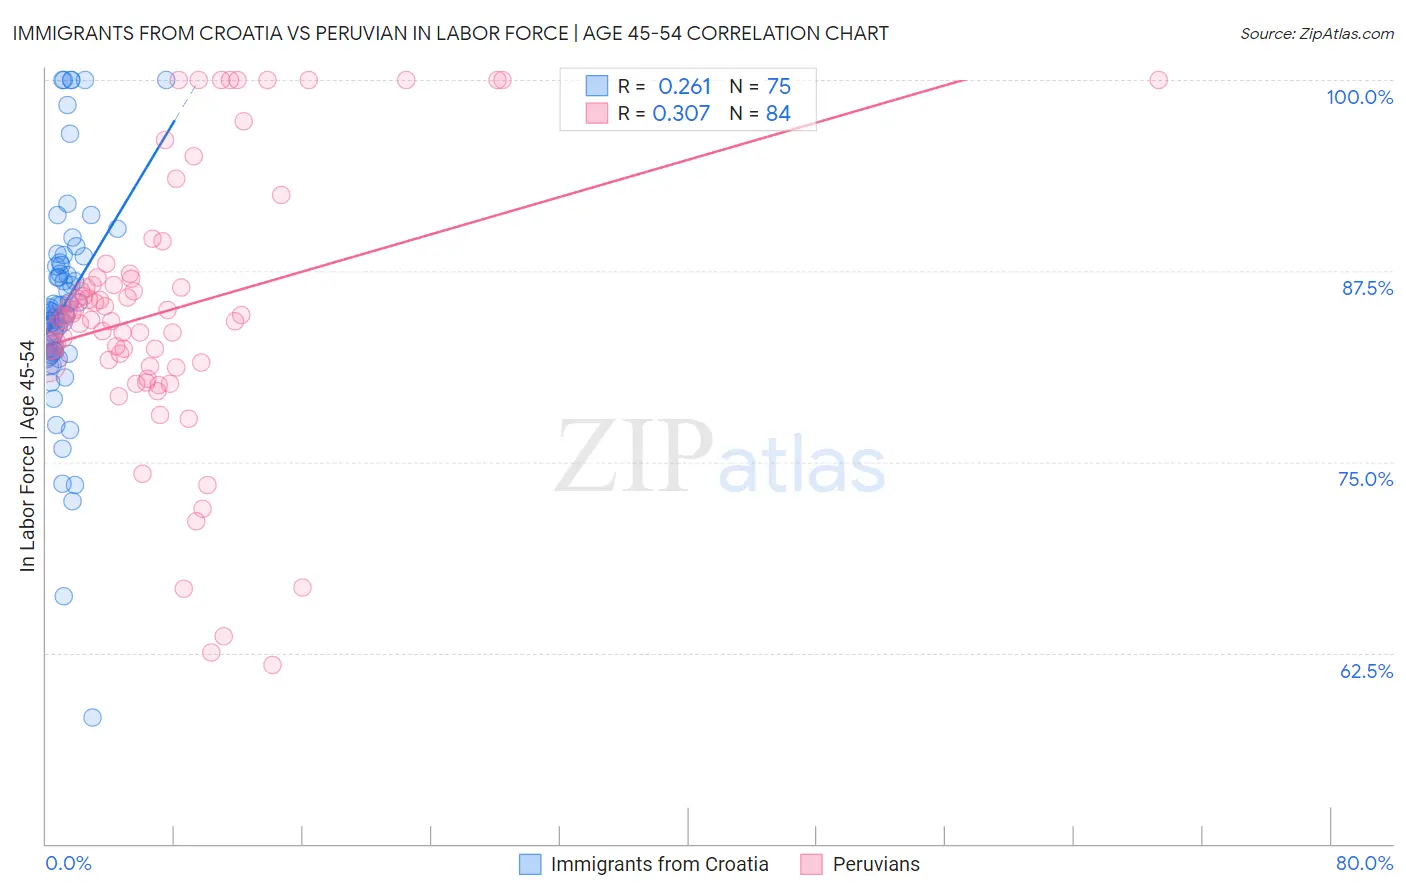
Immigrants from Croatia vs Peruvian In Labor Force | Age 45-54 Correlation Chart
The statistical analysis conducted on geographies consisting of 132,566,059 people shows a weak positive correlation between the proportion of Immigrants from Croatia and labor force participation rate among population between the ages 45 and 54 in the United States with a correlation coefficient (R) of 0.261 and weighted average of 83.4%. Similarly, the statistical analysis conducted on geographies consisting of 362,973,011 people shows a mild positive correlation between the proportion of Peruvians and labor force participation rate among population between the ages 45 and 54 in the United States with a correlation coefficient (R) of 0.307 and weighted average of 83.6%, a difference of 0.23%.
In Labor Force | Age 45-54 Correlation Summary
| Measurement | Immigrants from Croatia | Peruvian |
| Minimum | 58.3% | 61.7% |
| Maximum | 100.0% | 100.0% |
| Range | 41.7% | 38.3% |
| Mean | 85.2% | 84.9% |
| Median | 84.7% | 84.5% |
| Interquartile 25% (IQ1) | 82.2% | 81.5% |
| Interquartile 75% (IQ3) | 87.9% | 87.0% |
| Interquartile Range (IQR) | 5.7% | 5.6% |
| Standard Deviation (Sample) | 7.2% | 8.7% |
| Standard Deviation (Population) | 7.2% | 8.6% |
Similar Demographics by In Labor Force | Age 45-54
Demographics Similar to Immigrants from Croatia by In Labor Force | Age 45-54
In terms of in labor force | age 45-54, the demographic groups most similar to Immigrants from Croatia are Belgian (83.4%, a difference of 0.0%), Jordanian (83.4%, a difference of 0.0%), Immigrants from Egypt (83.4%, a difference of 0.010%), Immigrants from Eastern Asia (83.4%, a difference of 0.010%), and Immigrants from Zimbabwe (83.4%, a difference of 0.010%).
| Demographics | Rating | Rank | In Labor Force | Age 45-54 |
| Immigrants | Czechoslovakia | 97.1 /100 | #73 | Exceptional 83.4% |
| Immigrants | Somalia | 96.9 /100 | #74 | Exceptional 83.4% |
| Estonians | 96.9 /100 | #75 | Exceptional 83.4% |
| Russians | 96.8 /100 | #76 | Exceptional 83.4% |
| Cubans | 96.7 /100 | #77 | Exceptional 83.4% |
| Immigrants | Egypt | 96.6 /100 | #78 | Exceptional 83.4% |
| Belgians | 96.5 /100 | #79 | Exceptional 83.4% |
| Immigrants | Croatia | 96.5 /100 | #80 | Exceptional 83.4% |
| Jordanians | 96.4 /100 | #81 | Exceptional 83.4% |
| Immigrants | Eastern Asia | 96.3 /100 | #82 | Exceptional 83.4% |
| Immigrants | Zimbabwe | 96.3 /100 | #83 | Exceptional 83.4% |
| Immigrants | Bosnia and Herzegovina | 96.0 /100 | #84 | Exceptional 83.3% |
| Greeks | 95.9 /100 | #85 | Exceptional 83.3% |
| Immigrants | Northern Africa | 95.7 /100 | #86 | Exceptional 83.3% |
| Immigrants | Eastern Europe | 95.6 /100 | #87 | Exceptional 83.3% |
Demographics Similar to Peruvians by In Labor Force | Age 45-54
In terms of in labor force | age 45-54, the demographic groups most similar to Peruvians are Immigrants from Turkey (83.6%, a difference of 0.0%), Polish (83.6%, a difference of 0.0%), Immigrants from Greece (83.6%, a difference of 0.010%), Somali (83.5%, a difference of 0.010%), and Macedonian (83.5%, a difference of 0.020%).
| Demographics | Rating | Rank | In Labor Force | Age 45-54 |
| Lithuanians | 99.1 /100 | #46 | Exceptional 83.6% |
| Croatians | 99.0 /100 | #47 | Exceptional 83.6% |
| Immigrants | Poland | 99.0 /100 | #48 | Exceptional 83.6% |
| Immigrants | Morocco | 99.0 /100 | #49 | Exceptional 83.6% |
| Immigrants | Greece | 98.8 /100 | #50 | Exceptional 83.6% |
| Immigrants | Turkey | 98.8 /100 | #51 | Exceptional 83.6% |
| Poles | 98.7 /100 | #52 | Exceptional 83.6% |
| Peruvians | 98.7 /100 | #53 | Exceptional 83.6% |
| Somalis | 98.7 /100 | #54 | Exceptional 83.5% |
| Macedonians | 98.7 /100 | #55 | Exceptional 83.5% |
| Immigrants | Peru | 98.6 /100 | #56 | Exceptional 83.5% |
| Paraguayans | 98.5 /100 | #57 | Exceptional 83.5% |
| Eastern Europeans | 98.5 /100 | #58 | Exceptional 83.5% |
| Bhutanese | 98.3 /100 | #59 | Exceptional 83.5% |
| Carpatho Rusyns | 98.3 /100 | #60 | Exceptional 83.5% |