Immigrants from Costa Rica vs Bangladeshi In Labor Force | Age 45-54
COMPARE
Immigrants from Costa Rica
Bangladeshi
In Labor Force | Age 45-54
In Labor Force | Age 45-54 Comparison
Immigrants from Costa Rica
Bangladeshis
82.6%
IN LABOR FORCE | AGE 45-54
28.3/ 100
METRIC RATING
187th/ 347
METRIC RANK
81.3%
IN LABOR FORCE | AGE 45-54
0.0/ 100
METRIC RATING
270th/ 347
METRIC RANK
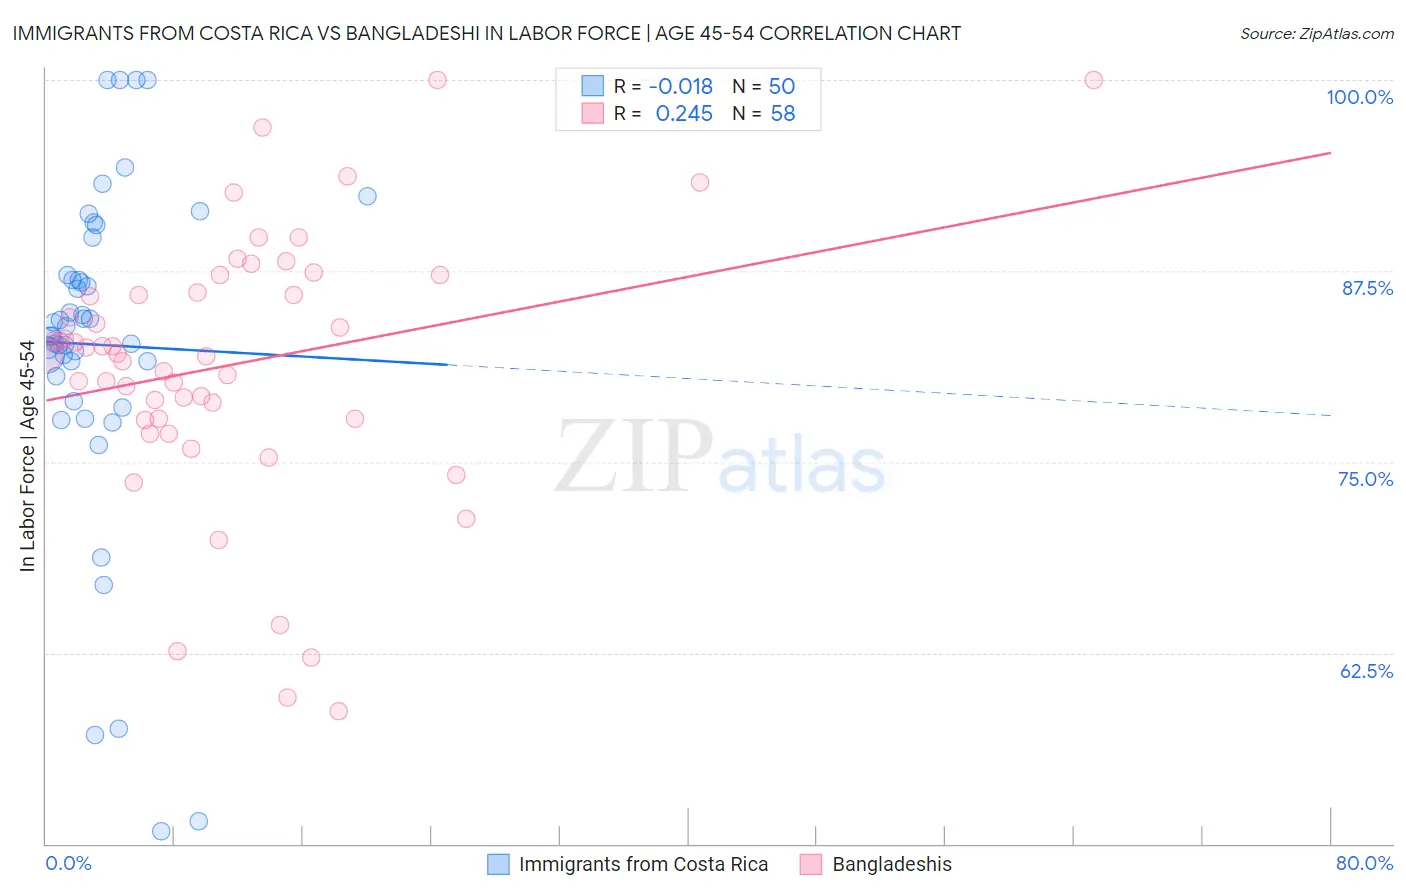
Immigrants from Costa Rica vs Bangladeshi In Labor Force | Age 45-54 Correlation Chart
The statistical analysis conducted on geographies consisting of 204,239,151 people shows no correlation between the proportion of Immigrants from Costa Rica and labor force participation rate among population between the ages 45 and 54 in the United States with a correlation coefficient (R) of -0.018 and weighted average of 82.6%. Similarly, the statistical analysis conducted on geographies consisting of 141,338,560 people shows a weak positive correlation between the proportion of Bangladeshis and labor force participation rate among population between the ages 45 and 54 in the United States with a correlation coefficient (R) of 0.245 and weighted average of 81.3%, a difference of 1.6%.
In Labor Force | Age 45-54 Correlation Summary
| Measurement | Immigrants from Costa Rica | Bangladeshi |
| Minimum | 50.8% | 58.7% |
| Maximum | 100.0% | 100.0% |
| Range | 49.2% | 41.3% |
| Mean | 82.7% | 81.4% |
| Median | 83.5% | 82.0% |
| Interquartile 25% (IQ1) | 80.6% | 77.8% |
| Interquartile 75% (IQ3) | 87.2% | 86.1% |
| Interquartile Range (IQR) | 6.6% | 8.3% |
| Standard Deviation (Sample) | 10.9% | 8.8% |
| Standard Deviation (Population) | 10.8% | 8.7% |
Similar Demographics by In Labor Force | Age 45-54
Demographics Similar to Immigrants from Costa Rica by In Labor Force | Age 45-54
In terms of in labor force | age 45-54, the demographic groups most similar to Immigrants from Costa Rica are South African (82.6%, a difference of 0.0%), Irish (82.6%, a difference of 0.010%), Syrian (82.6%, a difference of 0.030%), British (82.6%, a difference of 0.030%), and Immigrants from England (82.6%, a difference of 0.040%).
| Demographics | Rating | Rank | In Labor Force | Age 45-54 |
| Hungarians | 38.0 /100 | #180 | Fair 82.7% |
| Israelis | 37.7 /100 | #181 | Fair 82.7% |
| Immigrants | Hungary | 37.1 /100 | #182 | Fair 82.7% |
| New Zealanders | 32.7 /100 | #183 | Fair 82.6% |
| Europeans | 32.6 /100 | #184 | Fair 82.6% |
| Immigrants | England | 32.2 /100 | #185 | Fair 82.6% |
| Irish | 29.2 /100 | #186 | Fair 82.6% |
| Immigrants | Costa Rica | 28.3 /100 | #187 | Fair 82.6% |
| South Africans | 28.0 /100 | #188 | Fair 82.6% |
| Syrians | 26.0 /100 | #189 | Fair 82.6% |
| British | 25.7 /100 | #190 | Fair 82.6% |
| Armenians | 23.2 /100 | #191 | Fair 82.5% |
| Immigrants | Iraq | 20.9 /100 | #192 | Fair 82.5% |
| Australians | 20.8 /100 | #193 | Fair 82.5% |
| Immigrants | Norway | 20.7 /100 | #194 | Fair 82.5% |
Demographics Similar to Bangladeshis by In Labor Force | Age 45-54
In terms of in labor force | age 45-54, the demographic groups most similar to Bangladeshis are Immigrants from Barbados (81.3%, a difference of 0.010%), Spanish (81.3%, a difference of 0.010%), Alsatian (81.3%, a difference of 0.030%), Immigrants from Honduras (81.4%, a difference of 0.050%), and West Indian (81.4%, a difference of 0.070%).
| Demographics | Rating | Rank | In Labor Force | Age 45-54 |
| Indonesians | 0.1 /100 | #263 | Tragic 81.5% |
| Immigrants | West Indies | 0.1 /100 | #264 | Tragic 81.5% |
| Hondurans | 0.1 /100 | #265 | Tragic 81.4% |
| Immigrants | St. Vincent and the Grenadines | 0.1 /100 | #266 | Tragic 81.4% |
| West Indians | 0.1 /100 | #267 | Tragic 81.4% |
| Immigrants | Honduras | 0.0 /100 | #268 | Tragic 81.4% |
| Alsatians | 0.0 /100 | #269 | Tragic 81.3% |
| Bangladeshis | 0.0 /100 | #270 | Tragic 81.3% |
| Immigrants | Barbados | 0.0 /100 | #271 | Tragic 81.3% |
| Spanish | 0.0 /100 | #272 | Tragic 81.3% |
| Chippewa | 0.0 /100 | #273 | Tragic 81.3% |
| British West Indians | 0.0 /100 | #274 | Tragic 81.2% |
| Immigrants | Nonimmigrants | 0.0 /100 | #275 | Tragic 81.2% |
| U.S. Virgin Islanders | 0.0 /100 | #276 | Tragic 81.2% |
| Guatemalans | 0.0 /100 | #277 | Tragic 81.2% |