Immigrants from Brazil vs Swedish In Labor Force | Age 45-54
COMPARE
Immigrants from Brazil
Swedish
In Labor Force | Age 45-54
In Labor Force | Age 45-54 Comparison
Immigrants from Brazil
Swedes
83.9%
IN LABOR FORCE | AGE 45-54
99.8/ 100
METRIC RATING
27th/ 347
METRIC RANK
83.7%
IN LABOR FORCE | AGE 45-54
99.4/ 100
METRIC RATING
37th/ 347
METRIC RANK
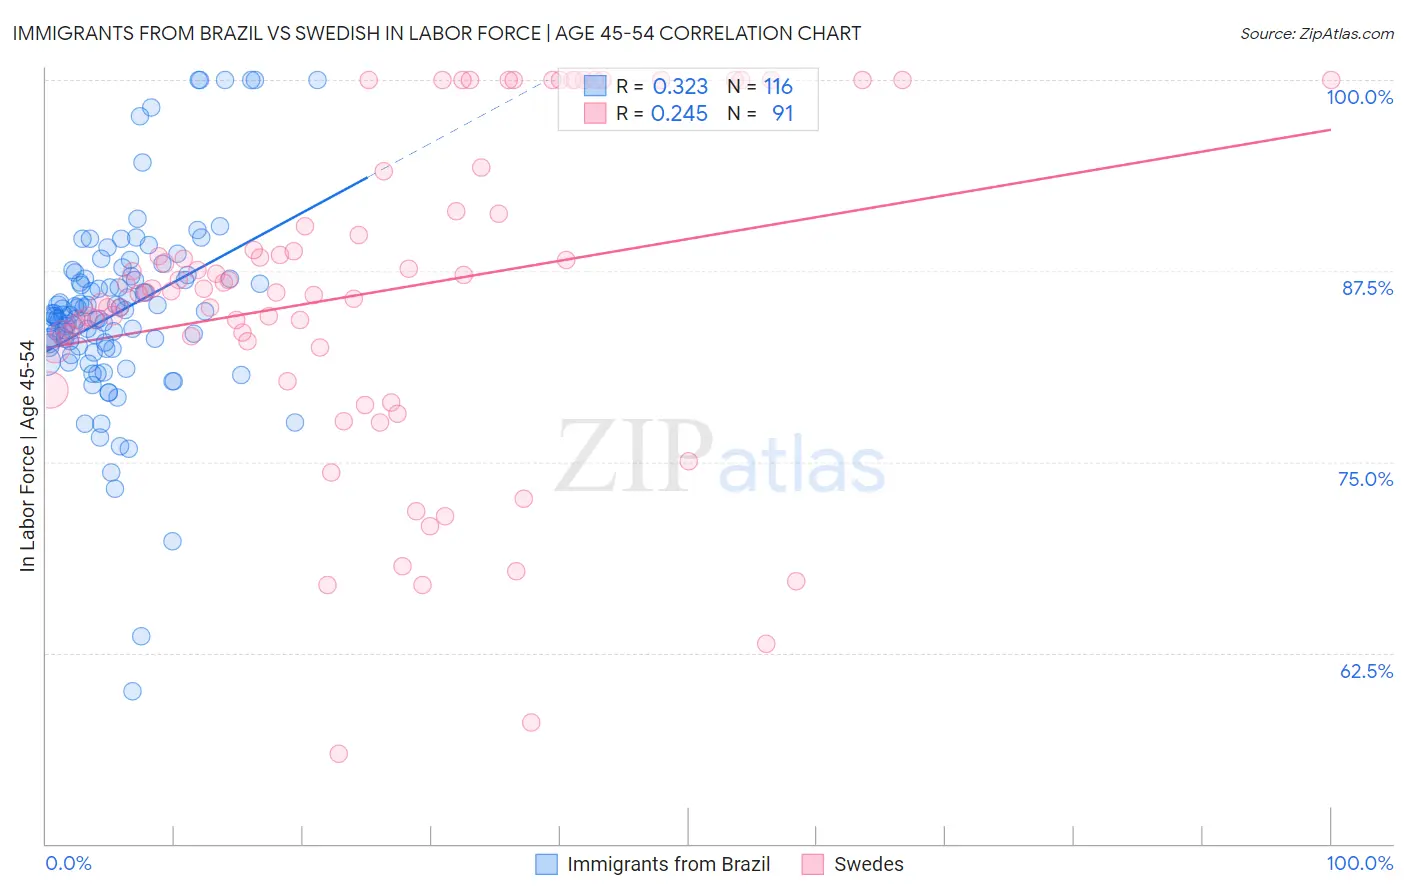
Immigrants from Brazil vs Swedish In Labor Force | Age 45-54 Correlation Chart
The statistical analysis conducted on geographies consisting of 342,845,252 people shows a mild positive correlation between the proportion of Immigrants from Brazil and labor force participation rate among population between the ages 45 and 54 in the United States with a correlation coefficient (R) of 0.323 and weighted average of 83.9%. Similarly, the statistical analysis conducted on geographies consisting of 538,655,146 people shows a weak positive correlation between the proportion of Swedes and labor force participation rate among population between the ages 45 and 54 in the United States with a correlation coefficient (R) of 0.245 and weighted average of 83.7%, a difference of 0.21%.
In Labor Force | Age 45-54 Correlation Summary
| Measurement | Immigrants from Brazil | Swedish |
| Minimum | 60.0% | 55.9% |
| Maximum | 100.0% | 100.0% |
| Range | 40.0% | 44.1% |
| Mean | 84.8% | 86.0% |
| Median | 84.6% | 86.2% |
| Interquartile 25% (IQ1) | 82.5% | 82.5% |
| Interquartile 75% (IQ3) | 87.0% | 91.4% |
| Interquartile Range (IQR) | 4.5% | 8.9% |
| Standard Deviation (Sample) | 6.2% | 10.4% |
| Standard Deviation (Population) | 6.2% | 10.3% |
Demographics Similar to Immigrants from Brazil and Swedes by In Labor Force | Age 45-54
In terms of in labor force | age 45-54, the demographic groups most similar to Immigrants from Brazil are Immigrants from Serbia (83.9%, a difference of 0.010%), Immigrants from Lithuania (83.9%, a difference of 0.010%), Immigrants from North Macedonia (83.9%, a difference of 0.020%), Immigrants from Pakistan (83.8%, a difference of 0.030%), and Slovene (83.9%, a difference of 0.040%). Similarly, the demographic groups most similar to Swedes are Immigrants from Venezuela (83.7%, a difference of 0.010%), Immigrants from Cuba (83.7%, a difference of 0.010%), Ugandan (83.7%, a difference of 0.020%), Immigrants from Uganda (83.7%, a difference of 0.020%), and Kenyan (83.7%, a difference of 0.030%).
| Demographics | Rating | Rank | In Labor Force | Age 45-54 |
| Immigrants | Ireland | 99.8 /100 | #22 | Exceptional 83.9% |
| Tlingit-Haida | 99.8 /100 | #23 | Exceptional 83.9% |
| Slovenes | 99.8 /100 | #24 | Exceptional 83.9% |
| Immigrants | North Macedonia | 99.8 /100 | #25 | Exceptional 83.9% |
| Immigrants | Serbia | 99.8 /100 | #26 | Exceptional 83.9% |
| Immigrants | Brazil | 99.8 /100 | #27 | Exceptional 83.9% |
| Immigrants | Lithuania | 99.8 /100 | #28 | Exceptional 83.9% |
| Immigrants | Pakistan | 99.7 /100 | #29 | Exceptional 83.8% |
| Immigrants | Bulgaria | 99.7 /100 | #30 | Exceptional 83.8% |
| Immigrants | Eritrea | 99.7 /100 | #31 | Exceptional 83.8% |
| Turks | 99.7 /100 | #32 | Exceptional 83.8% |
| Latvians | 99.7 /100 | #33 | Exceptional 83.8% |
| Kenyans | 99.5 /100 | #34 | Exceptional 83.7% |
| Brazilians | 99.5 /100 | #35 | Exceptional 83.7% |
| Ugandans | 99.5 /100 | #36 | Exceptional 83.7% |
| Swedes | 99.4 /100 | #37 | Exceptional 83.7% |
| Immigrants | Venezuela | 99.4 /100 | #38 | Exceptional 83.7% |
| Immigrants | Cuba | 99.4 /100 | #39 | Exceptional 83.7% |
| Immigrants | Uganda | 99.4 /100 | #40 | Exceptional 83.7% |
| Immigrants | Korea | 99.3 /100 | #41 | Exceptional 83.7% |
| Immigrants | Moldova | 99.3 /100 | #42 | Exceptional 83.7% |