Immigrants from Brazil vs Immigrants from Africa In Labor Force | Age 35-44
COMPARE
Immigrants from Brazil
Immigrants from Africa
In Labor Force | Age 35-44
In Labor Force | Age 35-44 Comparison
Immigrants from Brazil
Immigrants from Africa
85.0%
IN LABOR FORCE | AGE 35-44
99.2/ 100
METRIC RATING
65th/ 347
METRIC RANK
84.9%
IN LABOR FORCE | AGE 35-44
98.4/ 100
METRIC RATING
78th/ 347
METRIC RANK
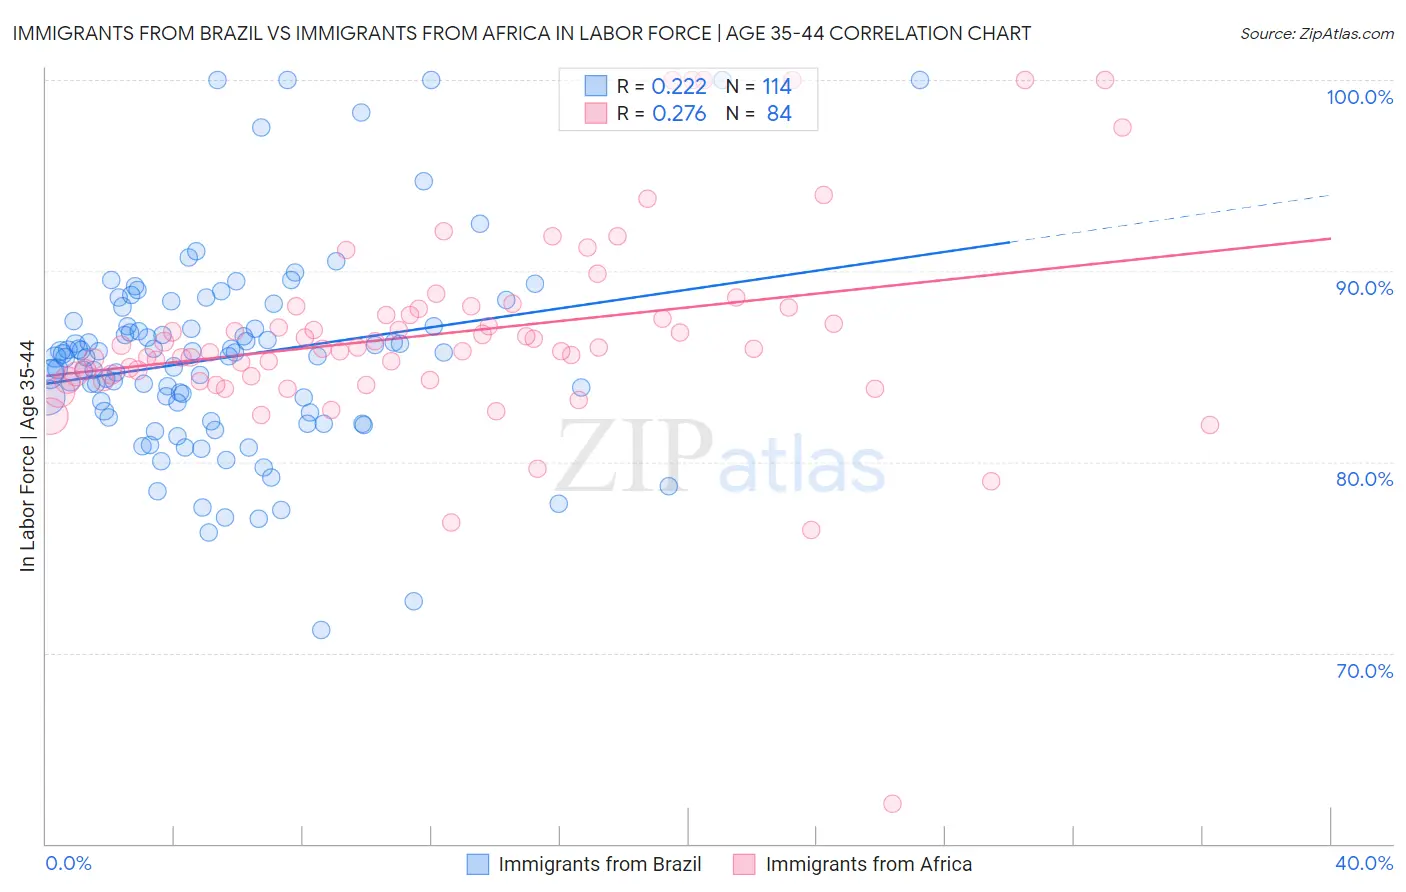
Immigrants from Brazil vs Immigrants from Africa In Labor Force | Age 35-44 Correlation Chart
The statistical analysis conducted on geographies consisting of 342,874,628 people shows a weak positive correlation between the proportion of Immigrants from Brazil and labor force participation rate among population between the ages 35 and 44 in the United States with a correlation coefficient (R) of 0.222 and weighted average of 85.0%. Similarly, the statistical analysis conducted on geographies consisting of 469,061,471 people shows a weak positive correlation between the proportion of Immigrants from Africa and labor force participation rate among population between the ages 35 and 44 in the United States with a correlation coefficient (R) of 0.276 and weighted average of 84.9%, a difference of 0.11%.
In Labor Force | Age 35-44 Correlation Summary
| Measurement | Immigrants from Brazil | Immigrants from Africa |
| Minimum | 71.2% | 62.1% |
| Maximum | 100.0% | 100.0% |
| Range | 28.8% | 37.9% |
| Mean | 85.5% | 86.8% |
| Median | 85.5% | 86.0% |
| Interquartile 25% (IQ1) | 82.6% | 84.4% |
| Interquartile 75% (IQ3) | 87.1% | 88.0% |
| Interquartile Range (IQR) | 4.5% | 3.7% |
| Standard Deviation (Sample) | 5.2% | 5.6% |
| Standard Deviation (Population) | 5.2% | 5.5% |
Demographics Similar to Immigrants from Brazil and Immigrants from Africa by In Labor Force | Age 35-44
In terms of in labor force | age 35-44, the demographic groups most similar to Immigrants from Brazil are Immigrants from Haiti (85.0%, a difference of 0.0%), Swedish (85.0%, a difference of 0.010%), Immigrants from Italy (85.0%, a difference of 0.010%), Immigrants from Moldova (85.0%, a difference of 0.020%), and Immigrants from Uganda (85.0%, a difference of 0.020%). Similarly, the demographic groups most similar to Immigrants from Africa are Peruvian (84.9%, a difference of 0.0%), Immigrants from Colombia (84.9%, a difference of 0.010%), Immigrants from Eastern Europe (84.9%, a difference of 0.010%), Immigrants from South Central Asia (85.0%, a difference of 0.030%), and Immigrants from Cuba (84.9%, a difference of 0.030%).
| Demographics | Rating | Rank | In Labor Force | Age 35-44 |
| Immigrants | Latvia | 99.3 /100 | #61 | Exceptional 85.0% |
| Immigrants | Moldova | 99.3 /100 | #62 | Exceptional 85.0% |
| Immigrants | Uganda | 99.3 /100 | #63 | Exceptional 85.0% |
| Swedes | 99.2 /100 | #64 | Exceptional 85.0% |
| Immigrants | Brazil | 99.2 /100 | #65 | Exceptional 85.0% |
| Immigrants | Haiti | 99.1 /100 | #66 | Exceptional 85.0% |
| Immigrants | Italy | 99.1 /100 | #67 | Exceptional 85.0% |
| Italians | 99.1 /100 | #68 | Exceptional 85.0% |
| Sudanese | 99.0 /100 | #69 | Exceptional 85.0% |
| Brazilians | 99.0 /100 | #70 | Exceptional 85.0% |
| Russians | 99.0 /100 | #71 | Exceptional 85.0% |
| Immigrants | Singapore | 98.9 /100 | #72 | Exceptional 85.0% |
| Immigrants | Sri Lanka | 98.9 /100 | #73 | Exceptional 85.0% |
| Colombians | 98.8 /100 | #74 | Exceptional 85.0% |
| Immigrants | South Central Asia | 98.7 /100 | #75 | Exceptional 85.0% |
| Immigrants | Cuba | 98.6 /100 | #76 | Exceptional 84.9% |
| Immigrants | Turkey | 98.6 /100 | #77 | Exceptional 84.9% |
| Immigrants | Africa | 98.4 /100 | #78 | Exceptional 84.9% |
| Peruvians | 98.3 /100 | #79 | Exceptional 84.9% |
| Immigrants | Colombia | 98.3 /100 | #80 | Exceptional 84.9% |
| Immigrants | Eastern Europe | 98.3 /100 | #81 | Exceptional 84.9% |