Immigrants from Brazil vs Aleut In Labor Force | Age 25-29
COMPARE
Immigrants from Brazil
Aleut
In Labor Force | Age 25-29
In Labor Force | Age 25-29 Comparison
Immigrants from Brazil
Aleuts
85.5%
IN LABOR FORCE | AGE 25-29
99.7/ 100
METRIC RATING
55th/ 347
METRIC RANK
83.4%
IN LABOR FORCE | AGE 25-29
0.0/ 100
METRIC RATING
266th/ 347
METRIC RANK
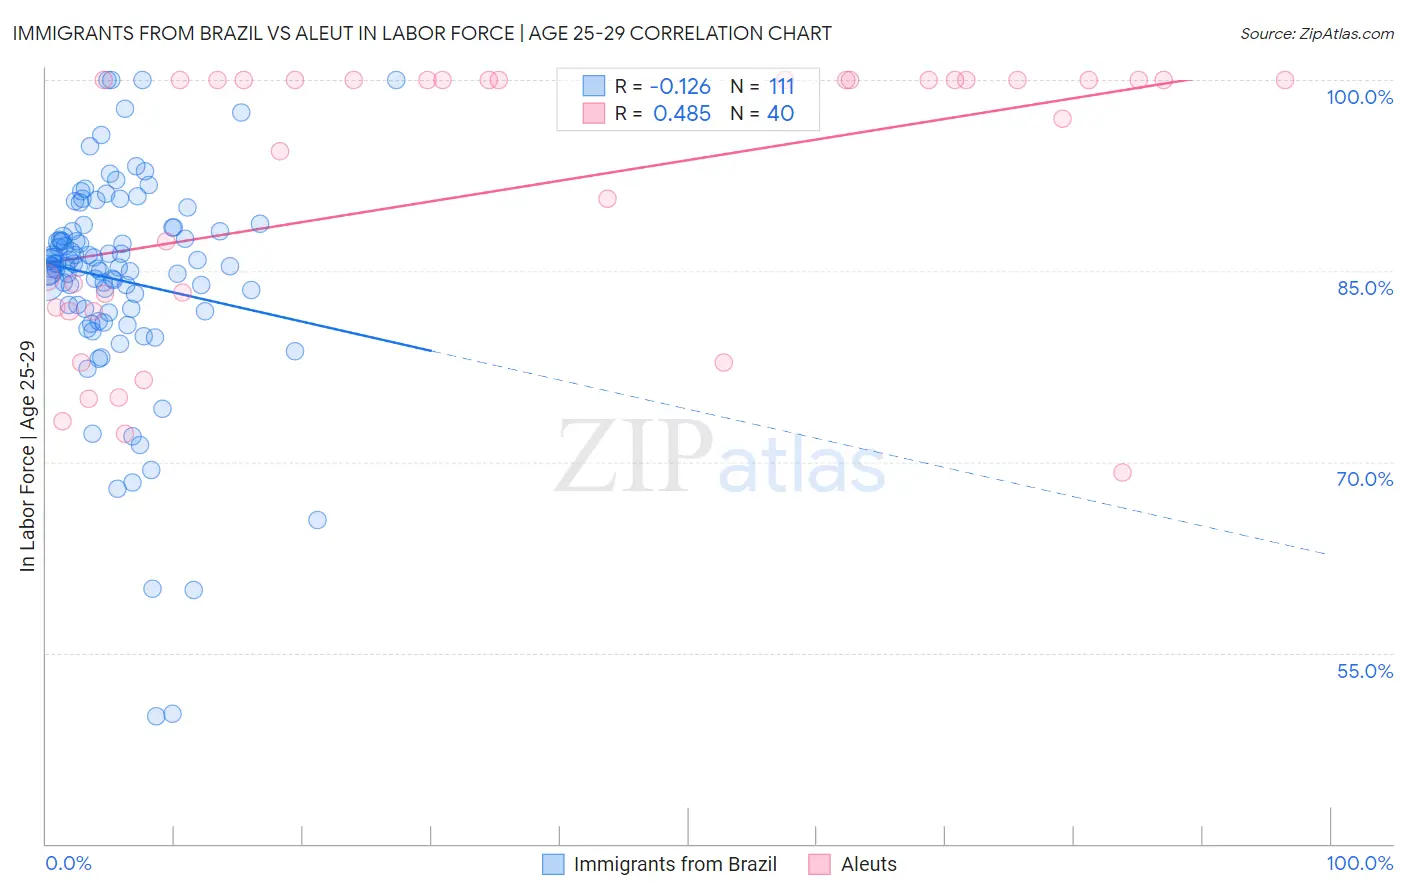
Immigrants from Brazil vs Aleut In Labor Force | Age 25-29 Correlation Chart
The statistical analysis conducted on geographies consisting of 342,914,577 people shows a poor negative correlation between the proportion of Immigrants from Brazil and labor force participation rate among population between the ages 25 and 29 in the United States with a correlation coefficient (R) of -0.126 and weighted average of 85.5%. Similarly, the statistical analysis conducted on geographies consisting of 61,770,091 people shows a moderate positive correlation between the proportion of Aleuts and labor force participation rate among population between the ages 25 and 29 in the United States with a correlation coefficient (R) of 0.485 and weighted average of 83.4%, a difference of 2.5%.
In Labor Force | Age 25-29 Correlation Summary
| Measurement | Immigrants from Brazil | Aleut |
| Minimum | 50.0% | 69.2% |
| Maximum | 100.0% | 100.0% |
| Range | 50.0% | 30.8% |
| Mean | 84.3% | 91.2% |
| Median | 85.4% | 100.0% |
| Interquartile 25% (IQ1) | 82.0% | 82.0% |
| Interquartile 75% (IQ3) | 88.1% | 100.0% |
| Interquartile Range (IQR) | 6.1% | 18.0% |
| Standard Deviation (Sample) | 8.6% | 10.7% |
| Standard Deviation (Population) | 8.5% | 10.5% |
Similar Demographics by In Labor Force | Age 25-29
Demographics Similar to Immigrants from Brazil by In Labor Force | Age 25-29
In terms of in labor force | age 25-29, the demographic groups most similar to Immigrants from Brazil are Belgian (85.5%, a difference of 0.010%), Albanian (85.5%, a difference of 0.010%), Eastern European (85.5%, a difference of 0.030%), Immigrants from Poland (85.6%, a difference of 0.040%), and Estonian (85.5%, a difference of 0.040%).
| Demographics | Rating | Rank | In Labor Force | Age 25-29 |
| Italians | 99.8 /100 | #48 | Exceptional 85.6% |
| Swedes | 99.8 /100 | #49 | Exceptional 85.6% |
| Yugoslavians | 99.8 /100 | #50 | Exceptional 85.6% |
| Immigrants | Latvia | 99.8 /100 | #51 | Exceptional 85.6% |
| Immigrants | Poland | 99.7 /100 | #52 | Exceptional 85.6% |
| Belgians | 99.7 /100 | #53 | Exceptional 85.5% |
| Albanians | 99.7 /100 | #54 | Exceptional 85.5% |
| Immigrants | Brazil | 99.7 /100 | #55 | Exceptional 85.5% |
| Eastern Europeans | 99.6 /100 | #56 | Exceptional 85.5% |
| Estonians | 99.6 /100 | #57 | Exceptional 85.5% |
| Greeks | 99.6 /100 | #58 | Exceptional 85.5% |
| Immigrants | Morocco | 99.5 /100 | #59 | Exceptional 85.5% |
| Thais | 99.5 /100 | #60 | Exceptional 85.5% |
| Serbians | 99.5 /100 | #61 | Exceptional 85.5% |
| Taiwanese | 99.4 /100 | #62 | Exceptional 85.4% |
Demographics Similar to Aleuts by In Labor Force | Age 25-29
In terms of in labor force | age 25-29, the demographic groups most similar to Aleuts are Spanish American (83.4%, a difference of 0.010%), Immigrants from Lebanon (83.4%, a difference of 0.020%), Immigrants from Barbados (83.4%, a difference of 0.020%), Puget Sound Salish (83.5%, a difference of 0.040%), and Cuban (83.5%, a difference of 0.040%).
| Demographics | Rating | Rank | In Labor Force | Age 25-29 |
| Spanish | 0.1 /100 | #259 | Tragic 83.6% |
| Immigrants | Bahamas | 0.1 /100 | #260 | Tragic 83.6% |
| Pennsylvania Germans | 0.1 /100 | #261 | Tragic 83.6% |
| Immigrants | Fiji | 0.1 /100 | #262 | Tragic 83.6% |
| West Indians | 0.1 /100 | #263 | Tragic 83.5% |
| Puget Sound Salish | 0.1 /100 | #264 | Tragic 83.5% |
| Cubans | 0.1 /100 | #265 | Tragic 83.5% |
| Aleuts | 0.0 /100 | #266 | Tragic 83.4% |
| Spanish Americans | 0.0 /100 | #267 | Tragic 83.4% |
| Immigrants | Lebanon | 0.0 /100 | #268 | Tragic 83.4% |
| Immigrants | Barbados | 0.0 /100 | #269 | Tragic 83.4% |
| Basques | 0.0 /100 | #270 | Tragic 83.4% |
| Hondurans | 0.0 /100 | #271 | Tragic 83.4% |
| Immigrants | Caribbean | 0.0 /100 | #272 | Tragic 83.4% |
| Immigrants | Dominica | 0.0 /100 | #273 | Tragic 83.4% |