Immigrants from Bosnia and Herzegovina vs Armenian In Labor Force | Age 45-54
COMPARE
Immigrants from Bosnia and Herzegovina
Armenian
In Labor Force | Age 45-54
In Labor Force | Age 45-54 Comparison
Immigrants from Bosnia and Herzegovina
Armenians
83.3%
IN LABOR FORCE | AGE 45-54
96.0/ 100
METRIC RATING
84th/ 347
METRIC RANK
82.5%
IN LABOR FORCE | AGE 45-54
23.2/ 100
METRIC RATING
191st/ 347
METRIC RANK
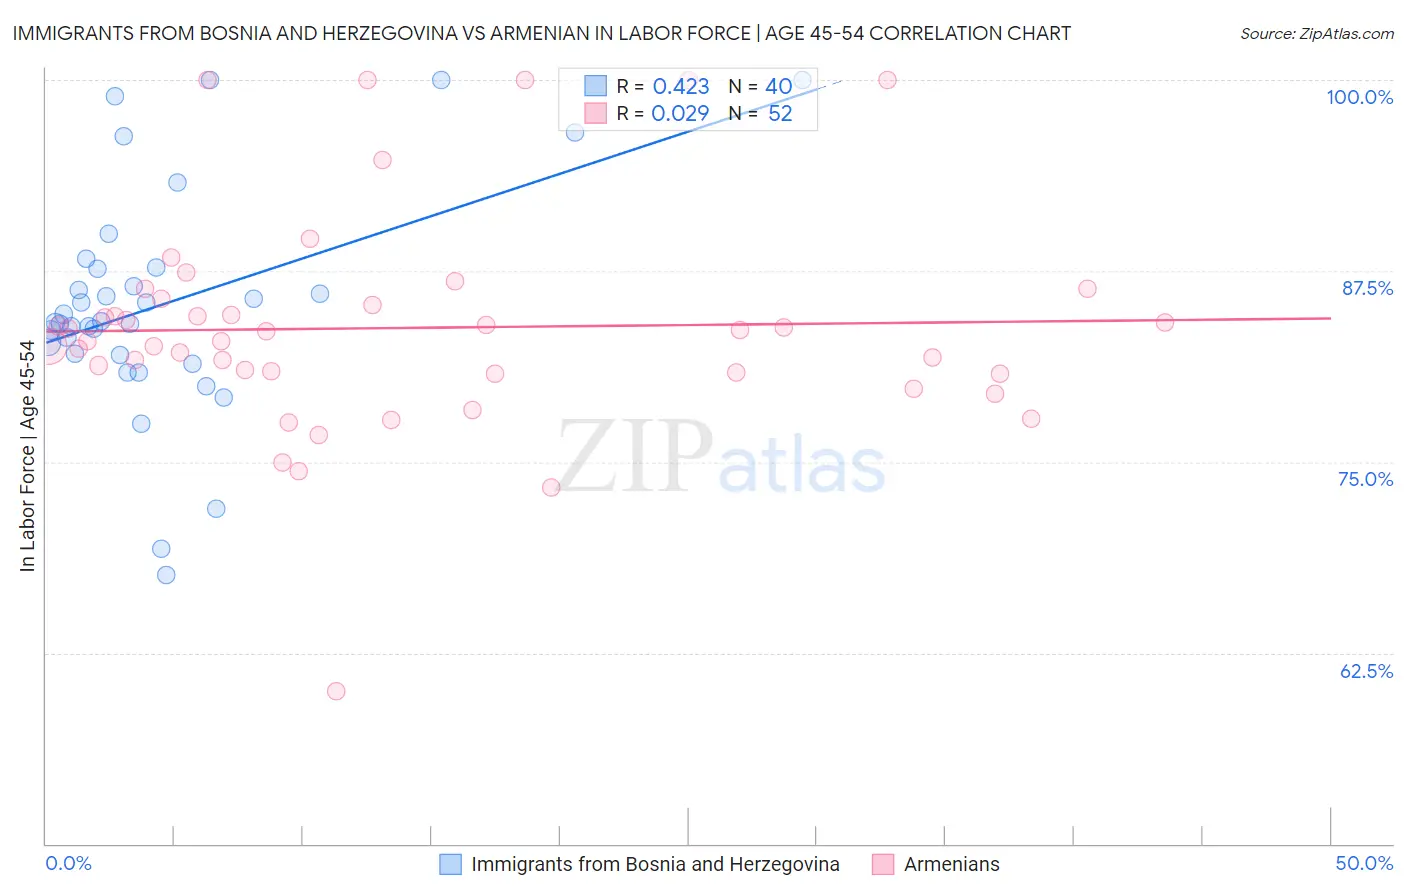
Immigrants from Bosnia and Herzegovina vs Armenian In Labor Force | Age 45-54 Correlation Chart
The statistical analysis conducted on geographies consisting of 156,805,510 people shows a moderate positive correlation between the proportion of Immigrants from Bosnia and Herzegovina and labor force participation rate among population between the ages 45 and 54 in the United States with a correlation coefficient (R) of 0.423 and weighted average of 83.3%. Similarly, the statistical analysis conducted on geographies consisting of 310,787,908 people shows no correlation between the proportion of Armenians and labor force participation rate among population between the ages 45 and 54 in the United States with a correlation coefficient (R) of 0.029 and weighted average of 82.5%, a difference of 0.97%.
In Labor Force | Age 45-54 Correlation Summary
| Measurement | Immigrants from Bosnia and Herzegovina | Armenian |
| Minimum | 67.6% | 60.0% |
| Maximum | 100.0% | 100.0% |
| Range | 32.4% | 40.0% |
| Mean | 85.4% | 83.8% |
| Median | 84.2% | 83.2% |
| Interquartile 25% (IQ1) | 82.0% | 80.8% |
| Interquartile 75% (IQ3) | 87.7% | 85.5% |
| Interquartile Range (IQR) | 5.6% | 4.7% |
| Standard Deviation (Sample) | 7.5% | 7.2% |
| Standard Deviation (Population) | 7.4% | 7.2% |
Similar Demographics by In Labor Force | Age 45-54
Demographics Similar to Immigrants from Bosnia and Herzegovina by In Labor Force | Age 45-54
In terms of in labor force | age 45-54, the demographic groups most similar to Immigrants from Bosnia and Herzegovina are Immigrants from Zimbabwe (83.4%, a difference of 0.010%), Greek (83.3%, a difference of 0.010%), Jordanian (83.4%, a difference of 0.020%), Immigrants from Eastern Asia (83.4%, a difference of 0.020%), and Immigrants from Northern Africa (83.3%, a difference of 0.020%).
| Demographics | Rating | Rank | In Labor Force | Age 45-54 |
| Cubans | 96.7 /100 | #77 | Exceptional 83.4% |
| Immigrants | Egypt | 96.6 /100 | #78 | Exceptional 83.4% |
| Belgians | 96.5 /100 | #79 | Exceptional 83.4% |
| Immigrants | Croatia | 96.5 /100 | #80 | Exceptional 83.4% |
| Jordanians | 96.4 /100 | #81 | Exceptional 83.4% |
| Immigrants | Eastern Asia | 96.3 /100 | #82 | Exceptional 83.4% |
| Immigrants | Zimbabwe | 96.3 /100 | #83 | Exceptional 83.4% |
| Immigrants | Bosnia and Herzegovina | 96.0 /100 | #84 | Exceptional 83.3% |
| Greeks | 95.9 /100 | #85 | Exceptional 83.3% |
| Immigrants | Northern Africa | 95.7 /100 | #86 | Exceptional 83.3% |
| Immigrants | Eastern Europe | 95.6 /100 | #87 | Exceptional 83.3% |
| Immigrants | Asia | 95.6 /100 | #88 | Exceptional 83.3% |
| Indians (Asian) | 95.5 /100 | #89 | Exceptional 83.3% |
| Immigrants | Japan | 95.5 /100 | #90 | Exceptional 83.3% |
| South Americans | 95.5 /100 | #91 | Exceptional 83.3% |
Demographics Similar to Armenians by In Labor Force | Age 45-54
In terms of in labor force | age 45-54, the demographic groups most similar to Armenians are Syrian (82.6%, a difference of 0.030%), British (82.6%, a difference of 0.030%), Immigrants from Iraq (82.5%, a difference of 0.030%), Australian (82.5%, a difference of 0.030%), and Immigrants from Norway (82.5%, a difference of 0.030%).
| Demographics | Rating | Rank | In Labor Force | Age 45-54 |
| Europeans | 32.6 /100 | #184 | Fair 82.6% |
| Immigrants | England | 32.2 /100 | #185 | Fair 82.6% |
| Irish | 29.2 /100 | #186 | Fair 82.6% |
| Immigrants | Costa Rica | 28.3 /100 | #187 | Fair 82.6% |
| South Africans | 28.0 /100 | #188 | Fair 82.6% |
| Syrians | 26.0 /100 | #189 | Fair 82.6% |
| British | 25.7 /100 | #190 | Fair 82.6% |
| Armenians | 23.2 /100 | #191 | Fair 82.5% |
| Immigrants | Iraq | 20.9 /100 | #192 | Fair 82.5% |
| Australians | 20.8 /100 | #193 | Fair 82.5% |
| Immigrants | Norway | 20.7 /100 | #194 | Fair 82.5% |
| Immigrants | Canada | 20.0 /100 | #195 | Fair 82.5% |
| Immigrants | North America | 18.8 /100 | #196 | Poor 82.5% |
| Lebanese | 18.2 /100 | #197 | Poor 82.5% |
| Immigrants | Denmark | 17.9 /100 | #198 | Poor 82.5% |