Immigrants from Bangladesh vs Asian In Labor Force | Age 45-54
COMPARE
Immigrants from Bangladesh
Asian
In Labor Force | Age 45-54
In Labor Force | Age 45-54 Comparison
Immigrants from Bangladesh
Asians
80.7%
IN LABOR FORCE | AGE 45-54
0.0/ 100
METRIC RATING
289th/ 347
METRIC RANK
83.4%
IN LABOR FORCE | AGE 45-54
97.7/ 100
METRIC RATING
66th/ 347
METRIC RANK
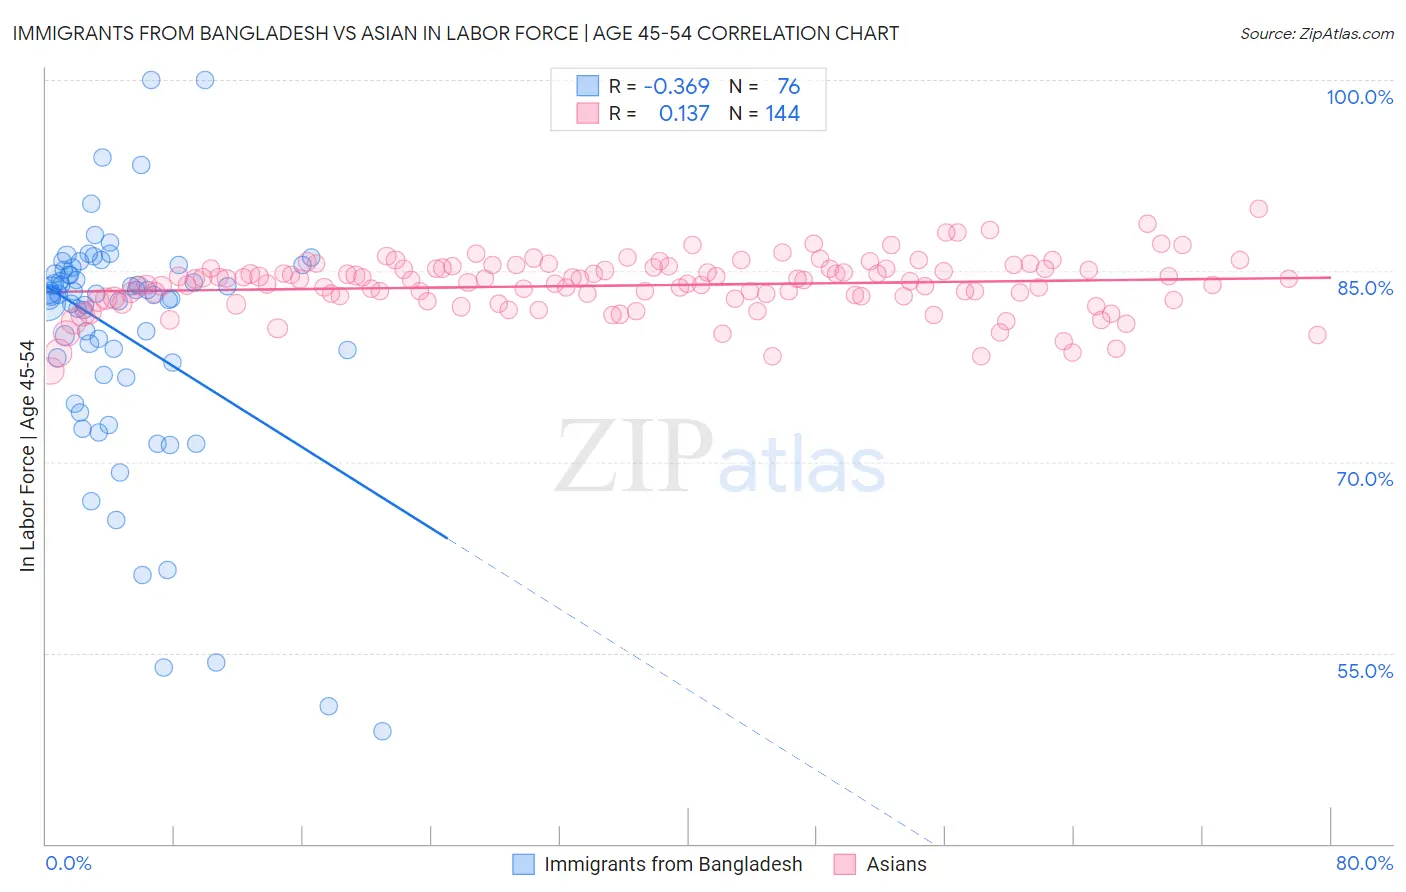
Immigrants from Bangladesh vs Asian In Labor Force | Age 45-54 Correlation Chart
The statistical analysis conducted on geographies consisting of 203,561,494 people shows a mild negative correlation between the proportion of Immigrants from Bangladesh and labor force participation rate among population between the ages 45 and 54 in the United States with a correlation coefficient (R) of -0.369 and weighted average of 80.7%. Similarly, the statistical analysis conducted on geographies consisting of 550,172,667 people shows a poor positive correlation between the proportion of Asians and labor force participation rate among population between the ages 45 and 54 in the United States with a correlation coefficient (R) of 0.137 and weighted average of 83.4%, a difference of 3.4%.
In Labor Force | Age 45-54 Correlation Summary
| Measurement | Immigrants from Bangladesh | Asian |
| Minimum | 48.8% | 77.1% |
| Maximum | 100.0% | 89.9% |
| Range | 51.2% | 12.8% |
| Mean | 80.0% | 83.9% |
| Median | 83.1% | 84.1% |
| Interquartile 25% (IQ1) | 77.3% | 82.8% |
| Interquartile 75% (IQ3) | 85.0% | 85.2% |
| Interquartile Range (IQR) | 7.6% | 2.3% |
| Standard Deviation (Sample) | 9.7% | 2.2% |
| Standard Deviation (Population) | 9.6% | 2.2% |
Similar Demographics by In Labor Force | Age 45-54
Demographics Similar to Immigrants from Bangladesh by In Labor Force | Age 45-54
In terms of in labor force | age 45-54, the demographic groups most similar to Immigrants from Bangladesh are Vietnamese (80.8%, a difference of 0.030%), Cree (80.8%, a difference of 0.030%), Mexican American Indian (80.7%, a difference of 0.030%), Delaware (80.8%, a difference of 0.040%), and Immigrants from Dominica (80.8%, a difference of 0.040%).
| Demographics | Rating | Rank | In Labor Force | Age 45-54 |
| Aleuts | 0.0 /100 | #282 | Tragic 81.0% |
| French American Indians | 0.0 /100 | #283 | Tragic 80.8% |
| Belizeans | 0.0 /100 | #284 | Tragic 80.8% |
| Delaware | 0.0 /100 | #285 | Tragic 80.8% |
| Immigrants | Dominica | 0.0 /100 | #286 | Tragic 80.8% |
| Vietnamese | 0.0 /100 | #287 | Tragic 80.8% |
| Cree | 0.0 /100 | #288 | Tragic 80.8% |
| Immigrants | Bangladesh | 0.0 /100 | #289 | Tragic 80.7% |
| Mexican American Indians | 0.0 /100 | #290 | Tragic 80.7% |
| Immigrants | Belize | 0.0 /100 | #291 | Tragic 80.6% |
| Iroquois | 0.0 /100 | #292 | Tragic 80.6% |
| Osage | 0.0 /100 | #293 | Tragic 80.6% |
| Yakama | 0.0 /100 | #294 | Tragic 80.6% |
| Nepalese | 0.0 /100 | #295 | Tragic 80.5% |
| Africans | 0.0 /100 | #296 | Tragic 80.5% |
Demographics Similar to Asians by In Labor Force | Age 45-54
In terms of in labor force | age 45-54, the demographic groups most similar to Asians are Chilean (83.4%, a difference of 0.0%), Egyptian (83.5%, a difference of 0.010%), Afghan (83.5%, a difference of 0.020%), Immigrants from Kenya (83.5%, a difference of 0.020%), and Immigrants from Colombia (83.4%, a difference of 0.020%).
| Demographics | Rating | Rank | In Labor Force | Age 45-54 |
| Bhutanese | 98.3 /100 | #59 | Exceptional 83.5% |
| Carpatho Rusyns | 98.3 /100 | #60 | Exceptional 83.5% |
| Filipinos | 98.3 /100 | #61 | Exceptional 83.5% |
| Immigrants | Taiwan | 98.0 /100 | #62 | Exceptional 83.5% |
| Afghans | 97.9 /100 | #63 | Exceptional 83.5% |
| Immigrants | Kenya | 97.9 /100 | #64 | Exceptional 83.5% |
| Egyptians | 97.9 /100 | #65 | Exceptional 83.5% |
| Asians | 97.7 /100 | #66 | Exceptional 83.4% |
| Chileans | 97.7 /100 | #67 | Exceptional 83.4% |
| Immigrants | Colombia | 97.6 /100 | #68 | Exceptional 83.4% |
| Taiwanese | 97.5 /100 | #69 | Exceptional 83.4% |
| Immigrants | Latvia | 97.4 /100 | #70 | Exceptional 83.4% |
| Colombians | 97.3 /100 | #71 | Exceptional 83.4% |
| Serbians | 97.2 /100 | #72 | Exceptional 83.4% |
| Immigrants | Czechoslovakia | 97.1 /100 | #73 | Exceptional 83.4% |