Immigrants from Australia vs Immigrants from Croatia In Labor Force | Age 25-29
COMPARE
Immigrants from Australia
Immigrants from Croatia
In Labor Force | Age 25-29
In Labor Force | Age 25-29 Comparison
Immigrants from Australia
Immigrants from Croatia
85.3%
IN LABOR FORCE | AGE 25-29
98.9/ 100
METRIC RATING
72nd/ 347
METRIC RANK
85.2%
IN LABOR FORCE | AGE 25-29
96.4/ 100
METRIC RATING
88th/ 347
METRIC RANK
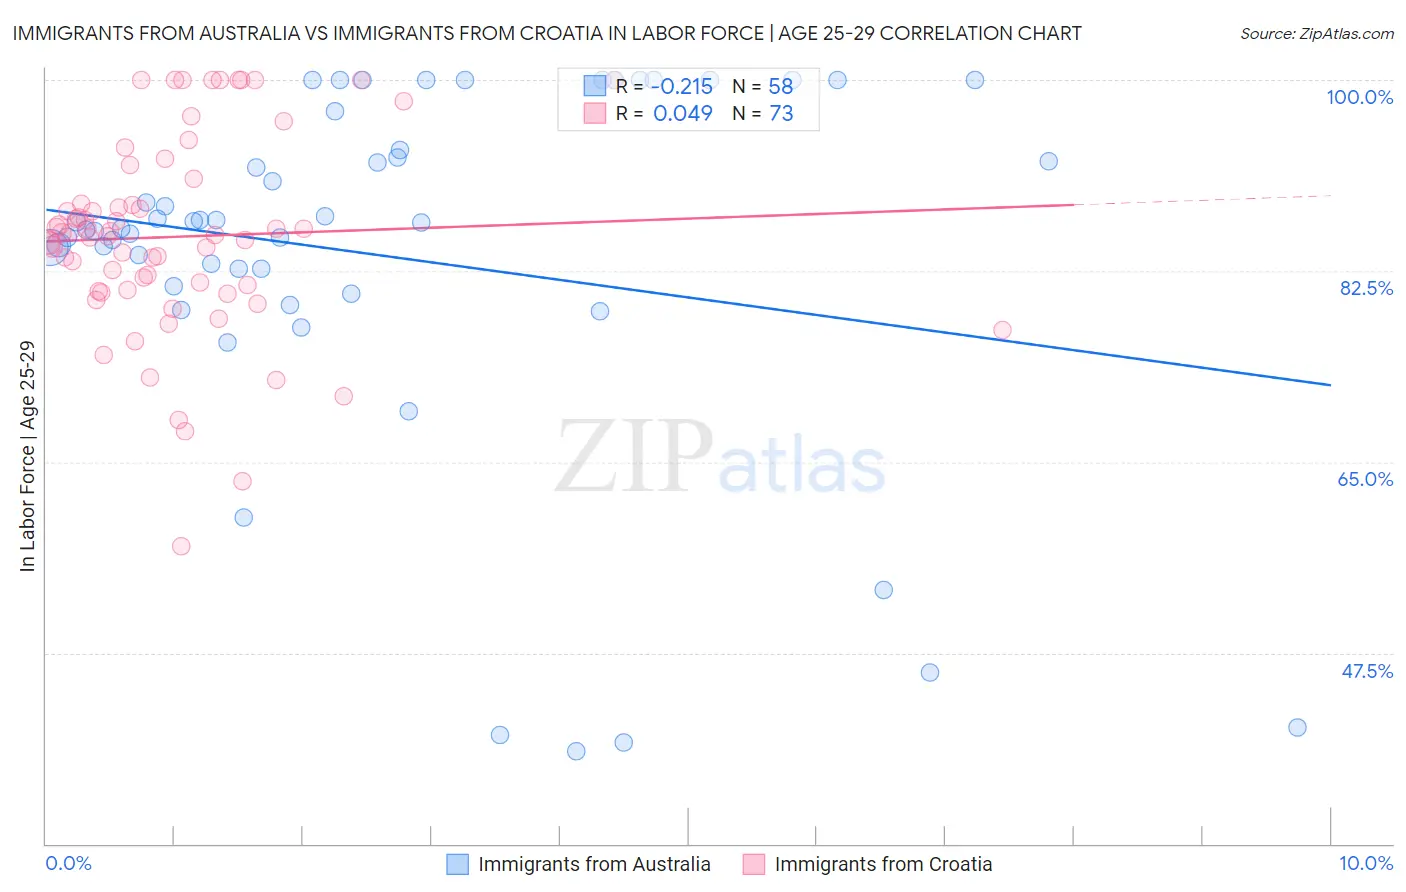
Immigrants from Australia vs Immigrants from Croatia In Labor Force | Age 25-29 Correlation Chart
The statistical analysis conducted on geographies consisting of 227,173,670 people shows a weak negative correlation between the proportion of Immigrants from Australia and labor force participation rate among population between the ages 25 and 29 in the United States with a correlation coefficient (R) of -0.215 and weighted average of 85.3%. Similarly, the statistical analysis conducted on geographies consisting of 132,545,183 people shows no correlation between the proportion of Immigrants from Croatia and labor force participation rate among population between the ages 25 and 29 in the United States with a correlation coefficient (R) of 0.049 and weighted average of 85.2%, a difference of 0.22%.
In Labor Force | Age 25-29 Correlation Summary
| Measurement | Immigrants from Australia | Immigrants from Croatia |
| Minimum | 38.5% | 57.3% |
| Maximum | 100.0% | 100.0% |
| Range | 61.5% | 42.7% |
| Mean | 83.9% | 85.6% |
| Median | 86.6% | 85.8% |
| Interquartile 25% (IQ1) | 81.1% | 80.7% |
| Interquartile 75% (IQ3) | 93.5% | 89.8% |
| Interquartile Range (IQR) | 12.5% | 9.1% |
| Standard Deviation (Sample) | 16.4% | 9.1% |
| Standard Deviation (Population) | 16.3% | 9.0% |
Demographics Similar to Immigrants from Australia and Immigrants from Croatia by In Labor Force | Age 25-29
In terms of in labor force | age 25-29, the demographic groups most similar to Immigrants from Australia are Russian (85.3%, a difference of 0.010%), Kenyan (85.4%, a difference of 0.020%), Immigrants from Sweden (85.4%, a difference of 0.040%), Soviet Union (85.3%, a difference of 0.050%), and Brazilian (85.3%, a difference of 0.080%). Similarly, the demographic groups most similar to Immigrants from Croatia are French Canadian (85.2%, a difference of 0.0%), Ukrainian (85.2%, a difference of 0.010%), Immigrants from France (85.2%, a difference of 0.010%), Immigrants from Europe (85.2%, a difference of 0.020%), and Immigrants from Eastern Europe (85.2%, a difference of 0.020%).
| Demographics | Rating | Rank | In Labor Force | Age 25-29 |
| Immigrants | Sweden | 99.1 /100 | #70 | Exceptional 85.4% |
| Kenyans | 99.0 /100 | #71 | Exceptional 85.4% |
| Immigrants | Australia | 98.9 /100 | #72 | Exceptional 85.3% |
| Russians | 98.8 /100 | #73 | Exceptional 85.3% |
| Soviet Union | 98.5 /100 | #74 | Exceptional 85.3% |
| Brazilians | 98.3 /100 | #75 | Exceptional 85.3% |
| Germans | 98.1 /100 | #76 | Exceptional 85.3% |
| Immigrants | South Central Asia | 97.9 /100 | #77 | Exceptional 85.2% |
| Immigrants | Egypt | 97.7 /100 | #78 | Exceptional 85.2% |
| Immigrants | Northern Africa | 97.6 /100 | #79 | Exceptional 85.2% |
| Immigrants | Zimbabwe | 97.6 /100 | #80 | Exceptional 85.2% |
| Immigrants | Northern Europe | 97.2 /100 | #81 | Exceptional 85.2% |
| Okinawans | 97.0 /100 | #82 | Exceptional 85.2% |
| Immigrants | Europe | 96.8 /100 | #83 | Exceptional 85.2% |
| Immigrants | Eastern Europe | 96.8 /100 | #84 | Exceptional 85.2% |
| Immigrants | Africa | 96.7 /100 | #85 | Exceptional 85.2% |
| Ukrainians | 96.7 /100 | #86 | Exceptional 85.2% |
| French Canadians | 96.5 /100 | #87 | Exceptional 85.2% |
| Immigrants | Croatia | 96.4 /100 | #88 | Exceptional 85.2% |
| Immigrants | France | 96.3 /100 | #89 | Exceptional 85.2% |
| Burmese | 95.9 /100 | #90 | Exceptional 85.1% |