Hungarian vs Subsaharan African In Labor Force | Age 25-29
COMPARE
Hungarian
Subsaharan African
In Labor Force | Age 25-29
In Labor Force | Age 25-29 Comparison
Hungarians
Sub-Saharan Africans
84.6%
IN LABOR FORCE | AGE 25-29
47.8/ 100
METRIC RATING
175th/ 347
METRIC RANK
84.3%
IN LABOR FORCE | AGE 25-29
11.7/ 100
METRIC RATING
212th/ 347
METRIC RANK
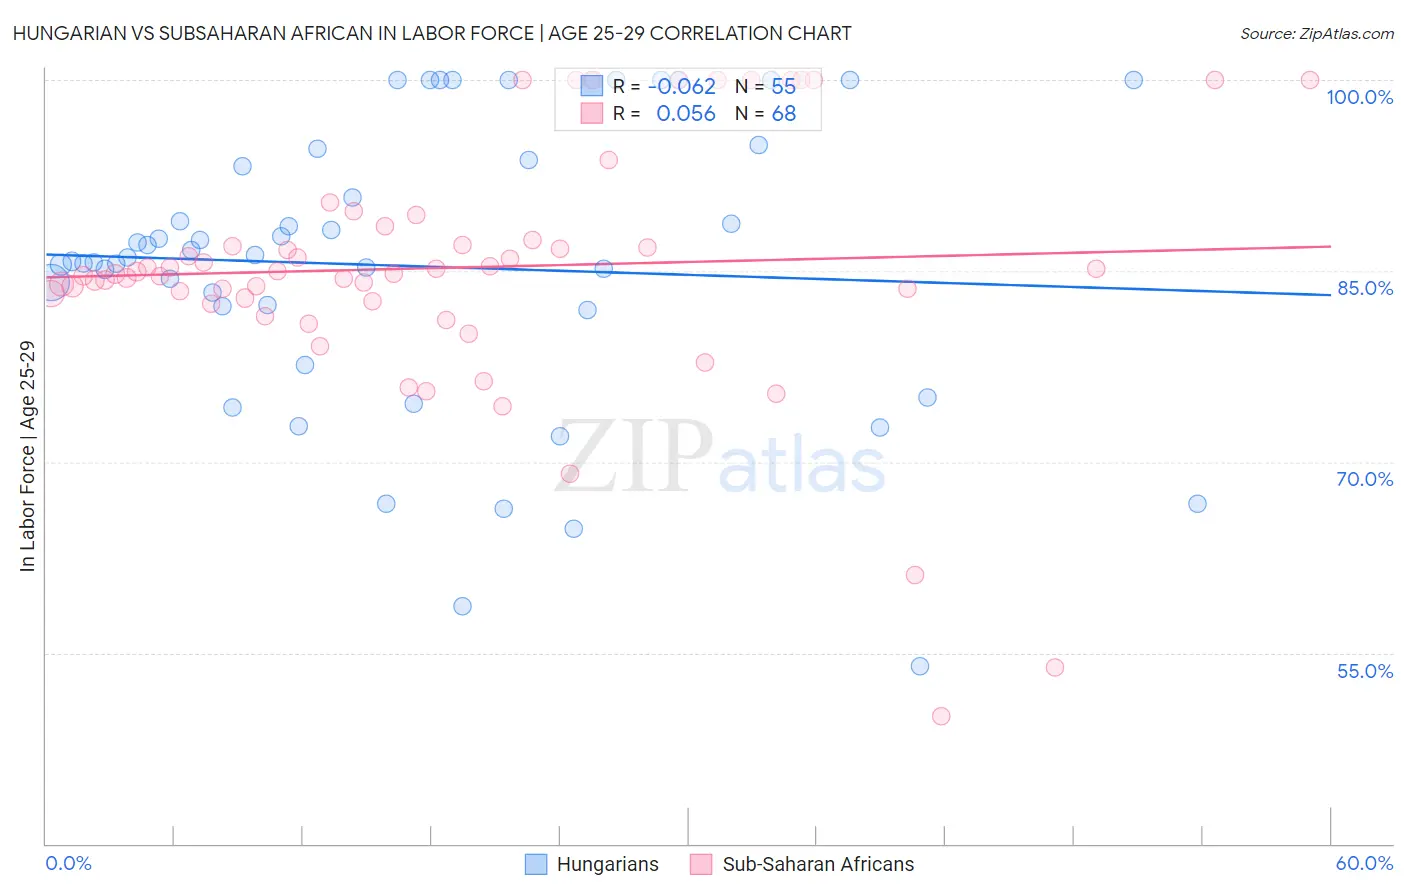
Hungarian vs Subsaharan African In Labor Force | Age 25-29 Correlation Chart
The statistical analysis conducted on geographies consisting of 485,787,626 people shows a slight negative correlation between the proportion of Hungarians and labor force participation rate among population between the ages 25 and 29 in the United States with a correlation coefficient (R) of -0.062 and weighted average of 84.6%. Similarly, the statistical analysis conducted on geographies consisting of 507,839,893 people shows a slight positive correlation between the proportion of Sub-Saharan Africans and labor force participation rate among population between the ages 25 and 29 in the United States with a correlation coefficient (R) of 0.056 and weighted average of 84.3%, a difference of 0.36%.
In Labor Force | Age 25-29 Correlation Summary
| Measurement | Hungarian | Subsaharan African |
| Minimum | 53.9% | 50.0% |
| Maximum | 100.0% | 100.0% |
| Range | 46.1% | 50.0% |
| Mean | 85.4% | 85.3% |
| Median | 86.0% | 84.9% |
| Interquartile 25% (IQ1) | 81.9% | 82.7% |
| Interquartile 75% (IQ3) | 93.7% | 88.0% |
| Interquartile Range (IQR) | 11.8% | 5.2% |
| Standard Deviation (Sample) | 11.3% | 9.9% |
| Standard Deviation (Population) | 11.2% | 9.8% |
Similar Demographics by In Labor Force | Age 25-29
Demographics Similar to Hungarians by In Labor Force | Age 25-29
In terms of in labor force | age 25-29, the demographic groups most similar to Hungarians are Malaysian (84.6%, a difference of 0.010%), Immigrants from Vietnam (84.7%, a difference of 0.020%), Immigrants from Western Europe (84.7%, a difference of 0.020%), Assyrian/Chaldean/Syriac (84.7%, a difference of 0.020%), and Palestinian (84.7%, a difference of 0.020%).
| Demographics | Rating | Rank | In Labor Force | Age 25-29 |
| South Americans | 54.9 /100 | #168 | Average 84.7% |
| Celtics | 52.5 /100 | #169 | Average 84.7% |
| Tongans | 52.4 /100 | #170 | Average 84.7% |
| Immigrants | Vietnam | 50.5 /100 | #171 | Average 84.7% |
| Immigrants | Western Europe | 50.4 /100 | #172 | Average 84.7% |
| Assyrians/Chaldeans/Syriacs | 50.2 /100 | #173 | Average 84.7% |
| Palestinians | 50.0 /100 | #174 | Average 84.7% |
| Hungarians | 47.8 /100 | #175 | Average 84.6% |
| Malaysians | 46.8 /100 | #176 | Average 84.6% |
| Immigrants | China | 45.7 /100 | #177 | Average 84.6% |
| Immigrants | Thailand | 45.2 /100 | #178 | Average 84.6% |
| Immigrants | Argentina | 44.0 /100 | #179 | Average 84.6% |
| Immigrants | South America | 42.9 /100 | #180 | Average 84.6% |
| Immigrants | Norway | 41.9 /100 | #181 | Average 84.6% |
| Europeans | 40.3 /100 | #182 | Average 84.6% |
Demographics Similar to Sub-Saharan Africans by In Labor Force | Age 25-29
In terms of in labor force | age 25-29, the demographic groups most similar to Sub-Saharan Africans are Japanese (84.3%, a difference of 0.0%), Lebanese (84.3%, a difference of 0.010%), Immigrants from Jordan (84.4%, a difference of 0.020%), Chinese (84.3%, a difference of 0.020%), and Immigrants from Venezuela (84.3%, a difference of 0.020%).
| Demographics | Rating | Rank | In Labor Force | Age 25-29 |
| Ecuadorians | 14.8 /100 | #205 | Poor 84.4% |
| Immigrants | Cambodia | 14.3 /100 | #206 | Poor 84.4% |
| Immigrants | Armenia | 13.3 /100 | #207 | Poor 84.4% |
| Immigrants | Indonesia | 13.2 /100 | #208 | Poor 84.4% |
| Immigrants | Jordan | 12.8 /100 | #209 | Poor 84.4% |
| Chinese | 12.7 /100 | #210 | Poor 84.3% |
| Immigrants | Venezuela | 12.6 /100 | #211 | Poor 84.3% |
| Sub-Saharan Africans | 11.7 /100 | #212 | Poor 84.3% |
| Japanese | 11.4 /100 | #213 | Poor 84.3% |
| Lebanese | 11.1 /100 | #214 | Poor 84.3% |
| Immigrants | Syria | 10.7 /100 | #215 | Poor 84.3% |
| Israelis | 9.3 /100 | #216 | Tragic 84.3% |
| Immigrants | Ecuador | 9.3 /100 | #217 | Tragic 84.3% |
| Immigrants | Nigeria | 9.0 /100 | #218 | Tragic 84.3% |
| Immigrants | Saudi Arabia | 8.8 /100 | #219 | Tragic 84.3% |