Egyptian vs Arapaho In Labor Force | Age 45-54
COMPARE
Egyptian
Arapaho
In Labor Force | Age 45-54
In Labor Force | Age 45-54 Comparison
Egyptians
Arapaho
83.5%
IN LABOR FORCE | AGE 45-54
97.9/ 100
METRIC RATING
65th/ 347
METRIC RANK
77.1%
IN LABOR FORCE | AGE 45-54
0.0/ 100
METRIC RATING
335th/ 347
METRIC RANK
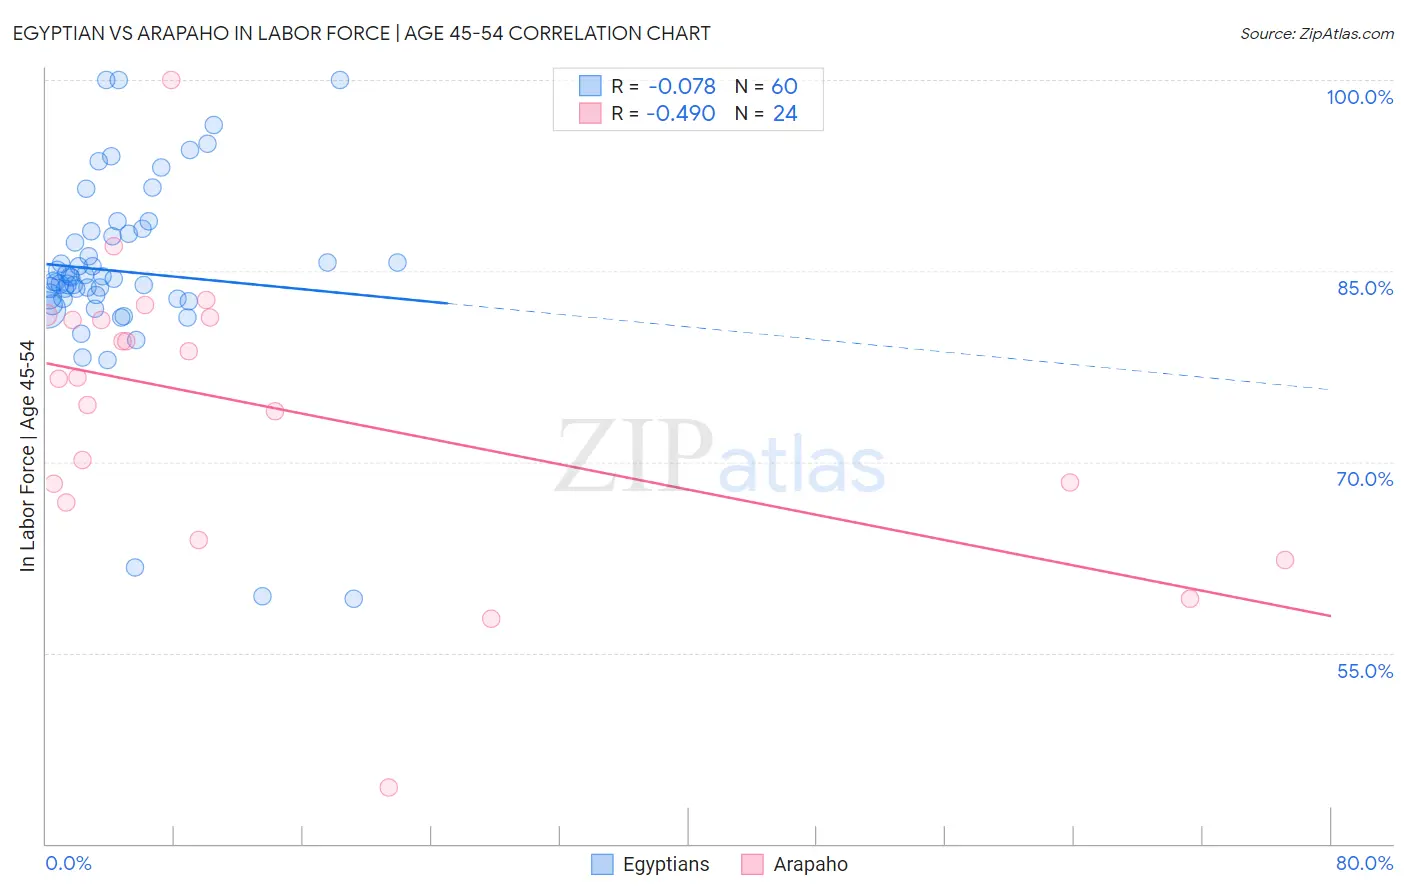
Egyptian vs Arapaho In Labor Force | Age 45-54 Correlation Chart
The statistical analysis conducted on geographies consisting of 276,763,301 people shows a slight negative correlation between the proportion of Egyptians and labor force participation rate among population between the ages 45 and 54 in the United States with a correlation coefficient (R) of -0.078 and weighted average of 83.5%. Similarly, the statistical analysis conducted on geographies consisting of 29,770,856 people shows a moderate negative correlation between the proportion of Arapaho and labor force participation rate among population between the ages 45 and 54 in the United States with a correlation coefficient (R) of -0.490 and weighted average of 77.1%, a difference of 8.3%.
In Labor Force | Age 45-54 Correlation Summary
| Measurement | Egyptian | Arapaho |
| Minimum | 59.2% | 44.4% |
| Maximum | 100.0% | 100.0% |
| Range | 40.8% | 55.6% |
| Mean | 84.9% | 74.1% |
| Median | 84.5% | 76.6% |
| Interquartile 25% (IQ1) | 82.8% | 67.6% |
| Interquartile 75% (IQ3) | 88.0% | 81.2% |
| Interquartile Range (IQR) | 5.2% | 13.7% |
| Standard Deviation (Sample) | 7.7% | 11.5% |
| Standard Deviation (Population) | 7.6% | 11.2% |
Similar Demographics by In Labor Force | Age 45-54
Demographics Similar to Egyptians by In Labor Force | Age 45-54
In terms of in labor force | age 45-54, the demographic groups most similar to Egyptians are Immigrants from Kenya (83.5%, a difference of 0.0%), Afghan (83.5%, a difference of 0.010%), Asian (83.4%, a difference of 0.010%), Chilean (83.4%, a difference of 0.010%), and Immigrants from Taiwan (83.5%, a difference of 0.020%).
| Demographics | Rating | Rank | In Labor Force | Age 45-54 |
| Eastern Europeans | 98.5 /100 | #58 | Exceptional 83.5% |
| Bhutanese | 98.3 /100 | #59 | Exceptional 83.5% |
| Carpatho Rusyns | 98.3 /100 | #60 | Exceptional 83.5% |
| Filipinos | 98.3 /100 | #61 | Exceptional 83.5% |
| Immigrants | Taiwan | 98.0 /100 | #62 | Exceptional 83.5% |
| Afghans | 97.9 /100 | #63 | Exceptional 83.5% |
| Immigrants | Kenya | 97.9 /100 | #64 | Exceptional 83.5% |
| Egyptians | 97.9 /100 | #65 | Exceptional 83.5% |
| Asians | 97.7 /100 | #66 | Exceptional 83.4% |
| Chileans | 97.7 /100 | #67 | Exceptional 83.4% |
| Immigrants | Colombia | 97.6 /100 | #68 | Exceptional 83.4% |
| Taiwanese | 97.5 /100 | #69 | Exceptional 83.4% |
| Immigrants | Latvia | 97.4 /100 | #70 | Exceptional 83.4% |
| Colombians | 97.3 /100 | #71 | Exceptional 83.4% |
| Serbians | 97.2 /100 | #72 | Exceptional 83.4% |
Demographics Similar to Arapaho by In Labor Force | Age 45-54
In terms of in labor force | age 45-54, the demographic groups most similar to Arapaho are Native/Alaskan (77.1%, a difference of 0.070%), Apache (77.1%, a difference of 0.070%), Menominee (77.4%, a difference of 0.43%), Tsimshian (77.4%, a difference of 0.46%), and Paiute (76.7%, a difference of 0.54%).
| Demographics | Rating | Rank | In Labor Force | Age 45-54 |
| Sioux | 0.0 /100 | #328 | Tragic 78.0% |
| Creek | 0.0 /100 | #329 | Tragic 77.7% |
| Cheyenne | 0.0 /100 | #330 | Tragic 77.6% |
| Tsimshian | 0.0 /100 | #331 | Tragic 77.4% |
| Menominee | 0.0 /100 | #332 | Tragic 77.4% |
| Natives/Alaskans | 0.0 /100 | #333 | Tragic 77.1% |
| Apache | 0.0 /100 | #334 | Tragic 77.1% |
| Arapaho | 0.0 /100 | #335 | Tragic 77.1% |
| Paiute | 0.0 /100 | #336 | Tragic 76.7% |
| Ute | 0.0 /100 | #337 | Tragic 76.6% |
| Yuman | 0.0 /100 | #338 | Tragic 76.3% |
| Puerto Ricans | 0.0 /100 | #339 | Tragic 75.9% |
| Lumbee | 0.0 /100 | #340 | Tragic 75.6% |
| Pueblo | 0.0 /100 | #341 | Tragic 75.5% |
| Tohono O'odham | 0.0 /100 | #342 | Tragic 75.1% |