Eastern European vs French Canadian In Labor Force | Age 25-29
COMPARE
Eastern European
French Canadian
In Labor Force | Age 25-29
In Labor Force | Age 25-29 Comparison
Eastern Europeans
French Canadians
85.5%
IN LABOR FORCE | AGE 25-29
99.6/ 100
METRIC RATING
56th/ 347
METRIC RANK
85.2%
IN LABOR FORCE | AGE 25-29
96.5/ 100
METRIC RATING
87th/ 347
METRIC RANK
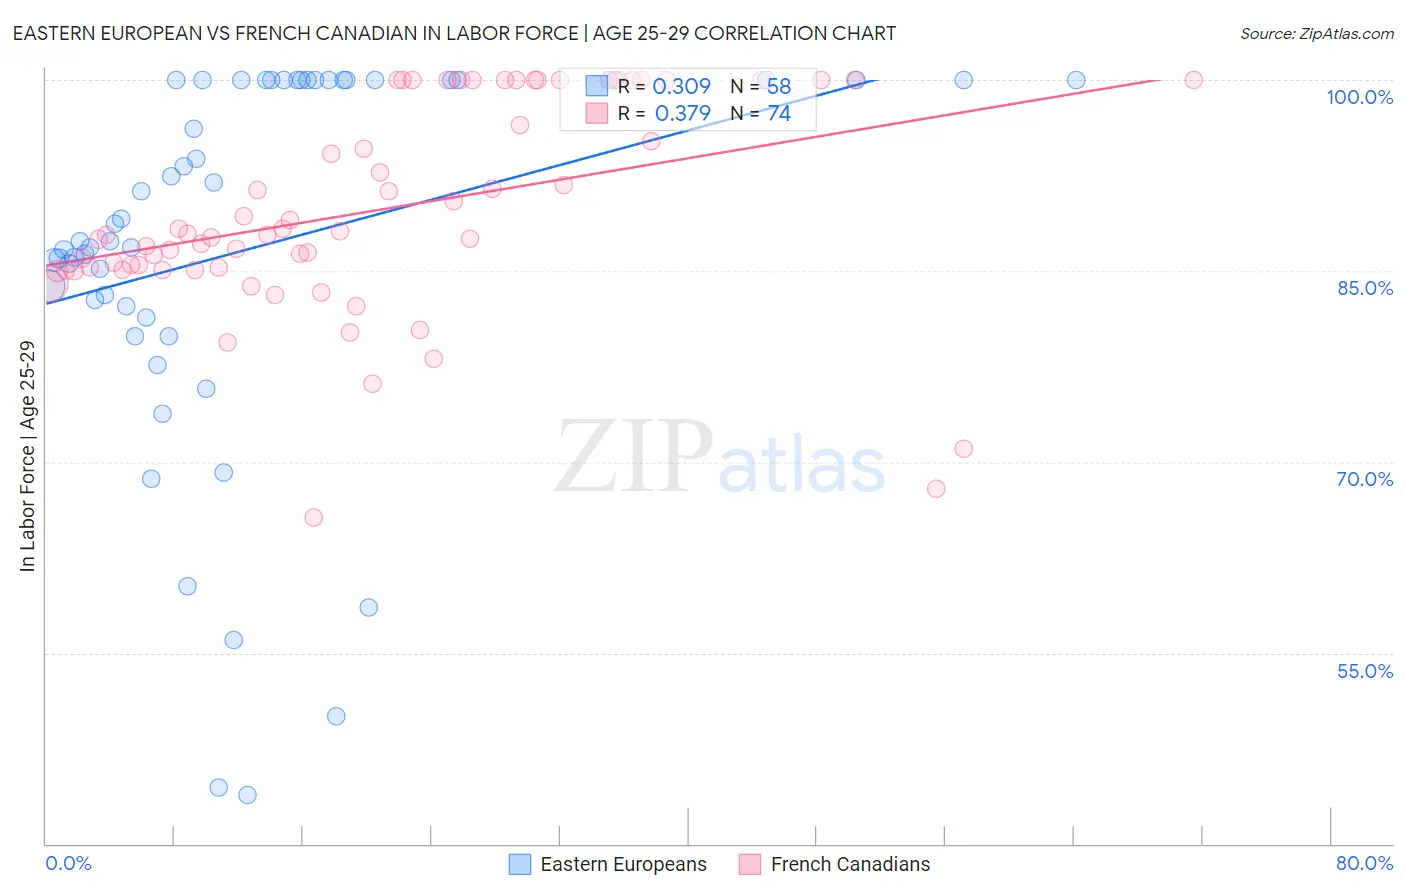
Eastern European vs French Canadian In Labor Force | Age 25-29 Correlation Chart
The statistical analysis conducted on geographies consisting of 460,900,054 people shows a mild positive correlation between the proportion of Eastern Europeans and labor force participation rate among population between the ages 25 and 29 in the United States with a correlation coefficient (R) of 0.309 and weighted average of 85.5%. Similarly, the statistical analysis conducted on geographies consisting of 502,121,240 people shows a mild positive correlation between the proportion of French Canadians and labor force participation rate among population between the ages 25 and 29 in the United States with a correlation coefficient (R) of 0.379 and weighted average of 85.2%, a difference of 0.40%.
In Labor Force | Age 25-29 Correlation Summary
| Measurement | Eastern European | French Canadian |
| Minimum | 43.8% | 65.6% |
| Maximum | 100.0% | 100.0% |
| Range | 56.2% | 34.4% |
| Mean | 86.9% | 89.8% |
| Median | 88.0% | 87.8% |
| Interquartile 25% (IQ1) | 82.2% | 85.1% |
| Interquartile 75% (IQ3) | 100.0% | 100.0% |
| Interquartile Range (IQR) | 17.8% | 14.9% |
| Standard Deviation (Sample) | 14.9% | 8.2% |
| Standard Deviation (Population) | 14.7% | 8.2% |
Similar Demographics by In Labor Force | Age 25-29
Demographics Similar to Eastern Europeans by In Labor Force | Age 25-29
In terms of in labor force | age 25-29, the demographic groups most similar to Eastern Europeans are Estonian (85.5%, a difference of 0.010%), Greek (85.5%, a difference of 0.010%), Immigrants from Morocco (85.5%, a difference of 0.020%), Immigrants from Brazil (85.5%, a difference of 0.030%), and Belgian (85.5%, a difference of 0.040%).
| Demographics | Rating | Rank | In Labor Force | Age 25-29 |
| Swedes | 99.8 /100 | #49 | Exceptional 85.6% |
| Yugoslavians | 99.8 /100 | #50 | Exceptional 85.6% |
| Immigrants | Latvia | 99.8 /100 | #51 | Exceptional 85.6% |
| Immigrants | Poland | 99.7 /100 | #52 | Exceptional 85.6% |
| Belgians | 99.7 /100 | #53 | Exceptional 85.5% |
| Albanians | 99.7 /100 | #54 | Exceptional 85.5% |
| Immigrants | Brazil | 99.7 /100 | #55 | Exceptional 85.5% |
| Eastern Europeans | 99.6 /100 | #56 | Exceptional 85.5% |
| Estonians | 99.6 /100 | #57 | Exceptional 85.5% |
| Greeks | 99.6 /100 | #58 | Exceptional 85.5% |
| Immigrants | Morocco | 99.5 /100 | #59 | Exceptional 85.5% |
| Thais | 99.5 /100 | #60 | Exceptional 85.5% |
| Serbians | 99.5 /100 | #61 | Exceptional 85.5% |
| Taiwanese | 99.4 /100 | #62 | Exceptional 85.4% |
| Immigrants | Kenya | 99.4 /100 | #63 | Exceptional 85.4% |
Demographics Similar to French Canadians by In Labor Force | Age 25-29
In terms of in labor force | age 25-29, the demographic groups most similar to French Canadians are Immigrants from Croatia (85.2%, a difference of 0.0%), Immigrants from Eastern Europe (85.2%, a difference of 0.010%), Immigrants from Africa (85.2%, a difference of 0.010%), Ukrainian (85.2%, a difference of 0.010%), and Immigrants from France (85.2%, a difference of 0.010%).
| Demographics | Rating | Rank | In Labor Force | Age 25-29 |
| Immigrants | Zimbabwe | 97.6 /100 | #80 | Exceptional 85.2% |
| Immigrants | Northern Europe | 97.2 /100 | #81 | Exceptional 85.2% |
| Okinawans | 97.0 /100 | #82 | Exceptional 85.2% |
| Immigrants | Europe | 96.8 /100 | #83 | Exceptional 85.2% |
| Immigrants | Eastern Europe | 96.8 /100 | #84 | Exceptional 85.2% |
| Immigrants | Africa | 96.7 /100 | #85 | Exceptional 85.2% |
| Ukrainians | 96.7 /100 | #86 | Exceptional 85.2% |
| French Canadians | 96.5 /100 | #87 | Exceptional 85.2% |
| Immigrants | Croatia | 96.4 /100 | #88 | Exceptional 85.2% |
| Immigrants | France | 96.3 /100 | #89 | Exceptional 85.2% |
| Burmese | 95.9 /100 | #90 | Exceptional 85.1% |
| Immigrants | Moldova | 95.8 /100 | #91 | Exceptional 85.1% |
| Immigrants | Costa Rica | 95.5 /100 | #92 | Exceptional 85.1% |
| Austrians | 95.3 /100 | #93 | Exceptional 85.1% |
| Immigrants | Korea | 94.8 /100 | #94 | Exceptional 85.1% |