Delaware vs Tlingit-Haida In Labor Force | Age 35-44
COMPARE
Delaware
Tlingit-Haida
In Labor Force | Age 35-44
In Labor Force | Age 35-44 Comparison
Delaware
Tlingit-Haida
83.2%
IN LABOR FORCE | AGE 35-44
0.0/ 100
METRIC RATING
276th/ 347
METRIC RANK
82.5%
IN LABOR FORCE | AGE 35-44
0.0/ 100
METRIC RATING
299th/ 347
METRIC RANK
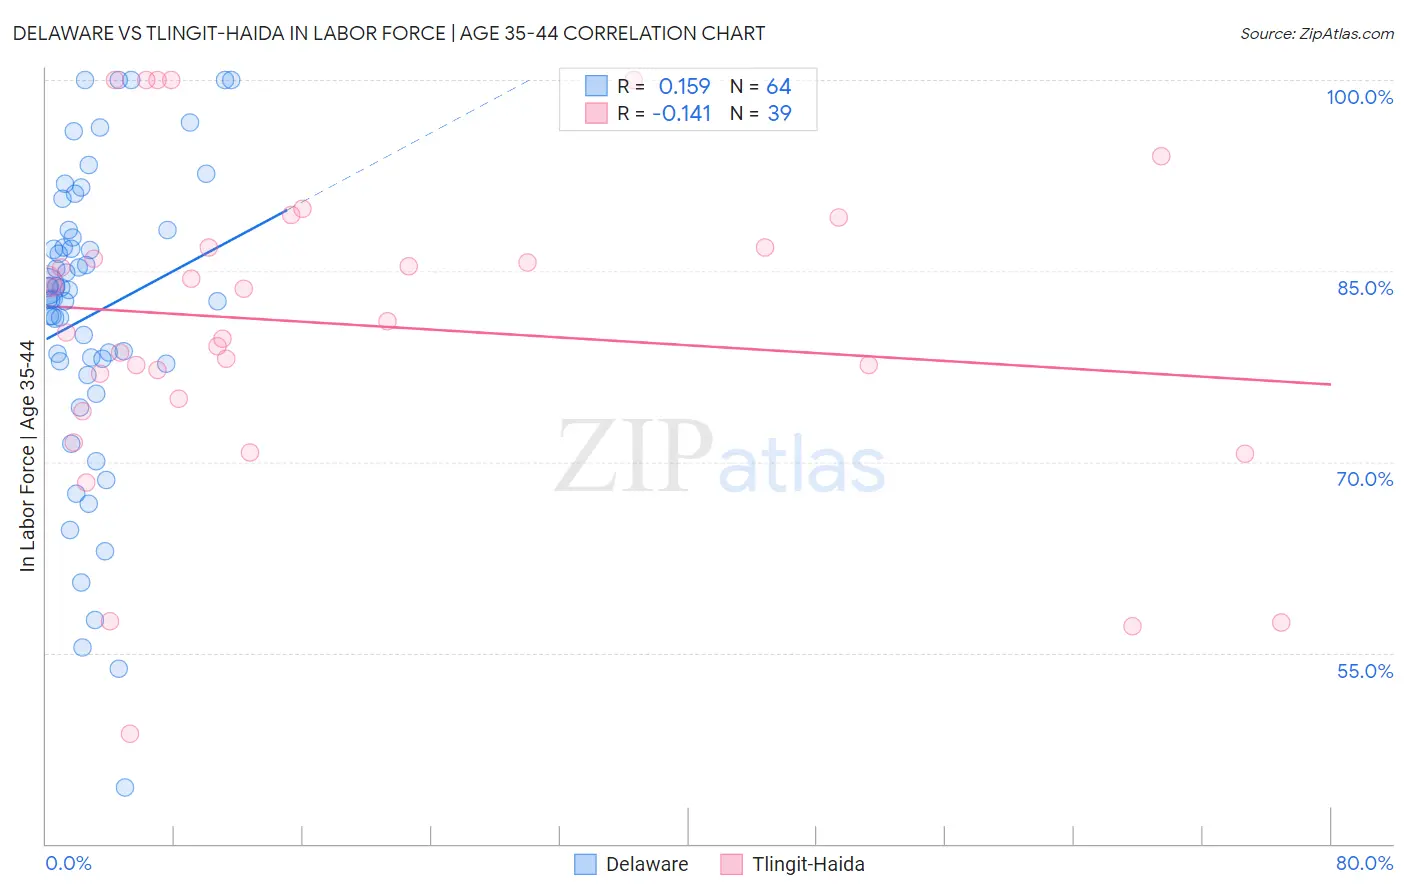
Delaware vs Tlingit-Haida In Labor Force | Age 35-44 Correlation Chart
The statistical analysis conducted on geographies consisting of 96,216,045 people shows a poor positive correlation between the proportion of Delaware and labor force participation rate among population between the ages 35 and 44 in the United States with a correlation coefficient (R) of 0.159 and weighted average of 83.2%. Similarly, the statistical analysis conducted on geographies consisting of 60,871,811 people shows a poor negative correlation between the proportion of Tlingit-Haida and labor force participation rate among population between the ages 35 and 44 in the United States with a correlation coefficient (R) of -0.141 and weighted average of 82.5%, a difference of 0.79%.
In Labor Force | Age 35-44 Correlation Summary
| Measurement | Delaware | Tlingit-Haida |
| Minimum | 44.4% | 48.6% |
| Maximum | 100.0% | 100.0% |
| Range | 55.6% | 51.4% |
| Mean | 81.5% | 80.8% |
| Median | 83.2% | 81.0% |
| Interquartile 25% (IQ1) | 77.8% | 75.0% |
| Interquartile 75% (IQ3) | 87.9% | 86.8% |
| Interquartile Range (IQR) | 10.1% | 11.8% |
| Standard Deviation (Sample) | 11.8% | 12.3% |
| Standard Deviation (Population) | 11.8% | 12.1% |
Similar Demographics by In Labor Force | Age 35-44
Demographics Similar to Delaware by In Labor Force | Age 35-44
In terms of in labor force | age 35-44, the demographic groups most similar to Delaware are Hawaiian (83.2%, a difference of 0.010%), Samoan (83.2%, a difference of 0.010%), Nonimmigrants (83.2%, a difference of 0.030%), Immigrants from Fiji (83.2%, a difference of 0.040%), and Spanish (83.2%, a difference of 0.040%).
| Demographics | Rating | Rank | In Labor Force | Age 35-44 |
| Immigrants | Grenada | 0.1 /100 | #269 | Tragic 83.3% |
| Immigrants | Honduras | 0.0 /100 | #270 | Tragic 83.3% |
| French American Indians | 0.0 /100 | #271 | Tragic 83.2% |
| Immigrants | Fiji | 0.0 /100 | #272 | Tragic 83.2% |
| Spanish | 0.0 /100 | #273 | Tragic 83.2% |
| Immigrants | Nonimmigrants | 0.0 /100 | #274 | Tragic 83.2% |
| Hawaiians | 0.0 /100 | #275 | Tragic 83.2% |
| Delaware | 0.0 /100 | #276 | Tragic 83.2% |
| Samoans | 0.0 /100 | #277 | Tragic 83.2% |
| Belizeans | 0.0 /100 | #278 | Tragic 83.1% |
| Immigrants | Micronesia | 0.0 /100 | #279 | Tragic 83.1% |
| Dominicans | 0.0 /100 | #280 | Tragic 83.1% |
| Guatemalans | 0.0 /100 | #281 | Tragic 83.0% |
| Osage | 0.0 /100 | #282 | Tragic 82.9% |
| Immigrants | Guatemala | 0.0 /100 | #283 | Tragic 82.9% |
Demographics Similar to Tlingit-Haida by In Labor Force | Age 35-44
In terms of in labor force | age 35-44, the demographic groups most similar to Tlingit-Haida are Ottawa (82.6%, a difference of 0.010%), Hmong (82.6%, a difference of 0.030%), Mexican American Indian (82.6%, a difference of 0.040%), Central American Indian (82.5%, a difference of 0.070%), and Spanish American Indian (82.5%, a difference of 0.090%).
| Demographics | Rating | Rank | In Labor Force | Age 35-44 |
| Immigrants | Latin America | 0.0 /100 | #292 | Tragic 82.8% |
| Spanish Americans | 0.0 /100 | #293 | Tragic 82.8% |
| Potawatomi | 0.0 /100 | #294 | Tragic 82.7% |
| Immigrants | Lebanon | 0.0 /100 | #295 | Tragic 82.7% |
| Mexican American Indians | 0.0 /100 | #296 | Tragic 82.6% |
| Hmong | 0.0 /100 | #297 | Tragic 82.6% |
| Ottawa | 0.0 /100 | #298 | Tragic 82.6% |
| Tlingit-Haida | 0.0 /100 | #299 | Tragic 82.5% |
| Central American Indians | 0.0 /100 | #300 | Tragic 82.5% |
| Spanish American Indians | 0.0 /100 | #301 | Tragic 82.5% |
| Americans | 0.0 /100 | #302 | Tragic 82.4% |
| Nepalese | 0.0 /100 | #303 | Tragic 82.4% |
| Marshallese | 0.0 /100 | #304 | Tragic 82.4% |
| Shoshone | 0.0 /100 | #305 | Tragic 82.2% |
| Blacks/African Americans | 0.0 /100 | #306 | Tragic 82.2% |