Colombian vs Vietnamese In Labor Force | Age 35-44
COMPARE
Colombian
Vietnamese
In Labor Force | Age 35-44
In Labor Force | Age 35-44 Comparison
Colombians
Vietnamese
85.0%
IN LABOR FORCE | AGE 35-44
98.8/ 100
METRIC RATING
74th/ 347
METRIC RANK
83.5%
IN LABOR FORCE | AGE 35-44
0.2/ 100
METRIC RATING
260th/ 347
METRIC RANK
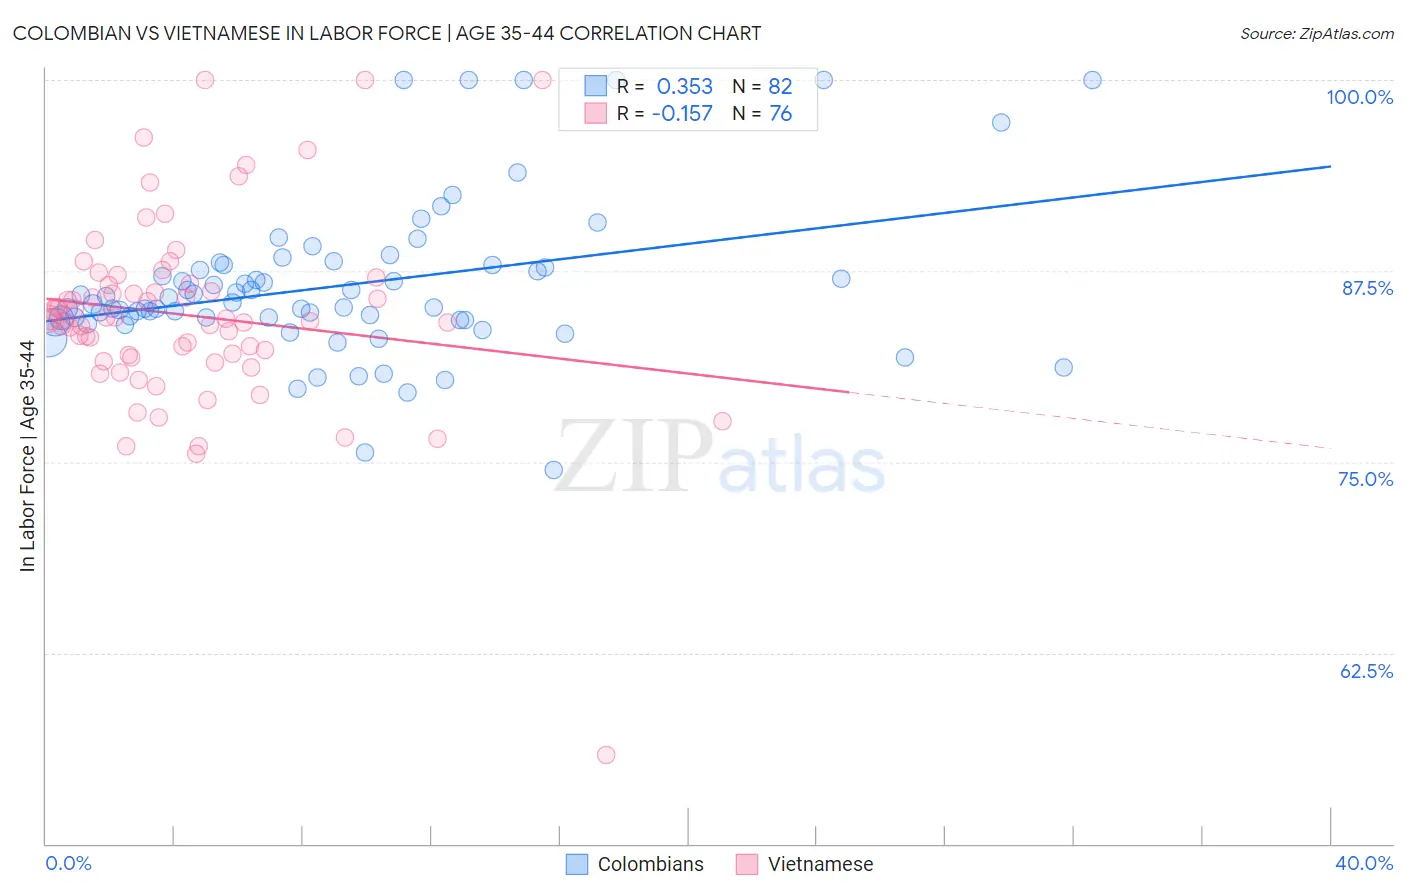
Colombian vs Vietnamese In Labor Force | Age 35-44 Correlation Chart
The statistical analysis conducted on geographies consisting of 419,405,199 people shows a mild positive correlation between the proportion of Colombians and labor force participation rate among population between the ages 35 and 44 in the United States with a correlation coefficient (R) of 0.353 and weighted average of 85.0%. Similarly, the statistical analysis conducted on geographies consisting of 170,595,548 people shows a poor negative correlation between the proportion of Vietnamese and labor force participation rate among population between the ages 35 and 44 in the United States with a correlation coefficient (R) of -0.157 and weighted average of 83.5%, a difference of 1.7%.
In Labor Force | Age 35-44 Correlation Summary
| Measurement | Colombian | Vietnamese |
| Minimum | 74.5% | 55.8% |
| Maximum | 100.0% | 100.0% |
| Range | 25.5% | 44.2% |
| Mean | 86.6% | 84.6% |
| Median | 85.4% | 84.4% |
| Interquartile 25% (IQ1) | 84.3% | 81.9% |
| Interquartile 75% (IQ3) | 87.9% | 86.6% |
| Interquartile Range (IQR) | 3.6% | 4.7% |
| Standard Deviation (Sample) | 5.1% | 6.3% |
| Standard Deviation (Population) | 5.1% | 6.2% |
Similar Demographics by In Labor Force | Age 35-44
Demographics Similar to Colombians by In Labor Force | Age 35-44
In terms of in labor force | age 35-44, the demographic groups most similar to Colombians are Immigrants from Singapore (85.0%, a difference of 0.010%), Immigrants from Sri Lanka (85.0%, a difference of 0.010%), Immigrants from South Central Asia (85.0%, a difference of 0.010%), Immigrants from Cuba (84.9%, a difference of 0.020%), and Immigrants from Turkey (84.9%, a difference of 0.020%).
| Demographics | Rating | Rank | In Labor Force | Age 35-44 |
| Immigrants | Italy | 99.1 /100 | #67 | Exceptional 85.0% |
| Italians | 99.1 /100 | #68 | Exceptional 85.0% |
| Sudanese | 99.0 /100 | #69 | Exceptional 85.0% |
| Brazilians | 99.0 /100 | #70 | Exceptional 85.0% |
| Russians | 99.0 /100 | #71 | Exceptional 85.0% |
| Immigrants | Singapore | 98.9 /100 | #72 | Exceptional 85.0% |
| Immigrants | Sri Lanka | 98.9 /100 | #73 | Exceptional 85.0% |
| Colombians | 98.8 /100 | #74 | Exceptional 85.0% |
| Immigrants | South Central Asia | 98.7 /100 | #75 | Exceptional 85.0% |
| Immigrants | Cuba | 98.6 /100 | #76 | Exceptional 84.9% |
| Immigrants | Turkey | 98.6 /100 | #77 | Exceptional 84.9% |
| Immigrants | Africa | 98.4 /100 | #78 | Exceptional 84.9% |
| Peruvians | 98.3 /100 | #79 | Exceptional 84.9% |
| Immigrants | Colombia | 98.3 /100 | #80 | Exceptional 84.9% |
| Immigrants | Eastern Europe | 98.3 /100 | #81 | Exceptional 84.9% |
Demographics Similar to Vietnamese by In Labor Force | Age 35-44
In terms of in labor force | age 35-44, the demographic groups most similar to Vietnamese are Immigrants from Dominica (83.5%, a difference of 0.0%), Immigrants from El Salvador (83.5%, a difference of 0.010%), Immigrants from Congo (83.5%, a difference of 0.010%), Tsimshian (83.5%, a difference of 0.030%), and Iroquois (83.5%, a difference of 0.040%).
| Demographics | Rating | Rank | In Labor Force | Age 35-44 |
| Lebanese | 0.4 /100 | #253 | Tragic 83.6% |
| Tongans | 0.4 /100 | #254 | Tragic 83.6% |
| Immigrants | Azores | 0.3 /100 | #255 | Tragic 83.6% |
| Japanese | 0.3 /100 | #256 | Tragic 83.6% |
| Basques | 0.3 /100 | #257 | Tragic 83.6% |
| Tsimshian | 0.2 /100 | #258 | Tragic 83.5% |
| Immigrants | El Salvador | 0.2 /100 | #259 | Tragic 83.5% |
| Vietnamese | 0.2 /100 | #260 | Tragic 83.5% |
| Immigrants | Dominica | 0.2 /100 | #261 | Tragic 83.5% |
| Immigrants | Congo | 0.2 /100 | #262 | Tragic 83.5% |
| Iroquois | 0.2 /100 | #263 | Tragic 83.5% |
| Scotch-Irish | 0.1 /100 | #264 | Tragic 83.5% |
| Central Americans | 0.1 /100 | #265 | Tragic 83.5% |
| Spaniards | 0.1 /100 | #266 | Tragic 83.4% |
| Guamanians/Chamorros | 0.1 /100 | #267 | Tragic 83.4% |