Chippewa vs Immigrants from Serbia In Labor Force | Age 30-34
COMPARE
Chippewa
Immigrants from Serbia
In Labor Force | Age 30-34
In Labor Force | Age 30-34 Comparison
Chippewa
Immigrants from Serbia
82.6%
IN LABOR FORCE | AGE 30-34
0.0/ 100
METRIC RATING
296th/ 347
METRIC RANK
86.2%
IN LABOR FORCE | AGE 30-34
100.0/ 100
METRIC RATING
10th/ 347
METRIC RANK
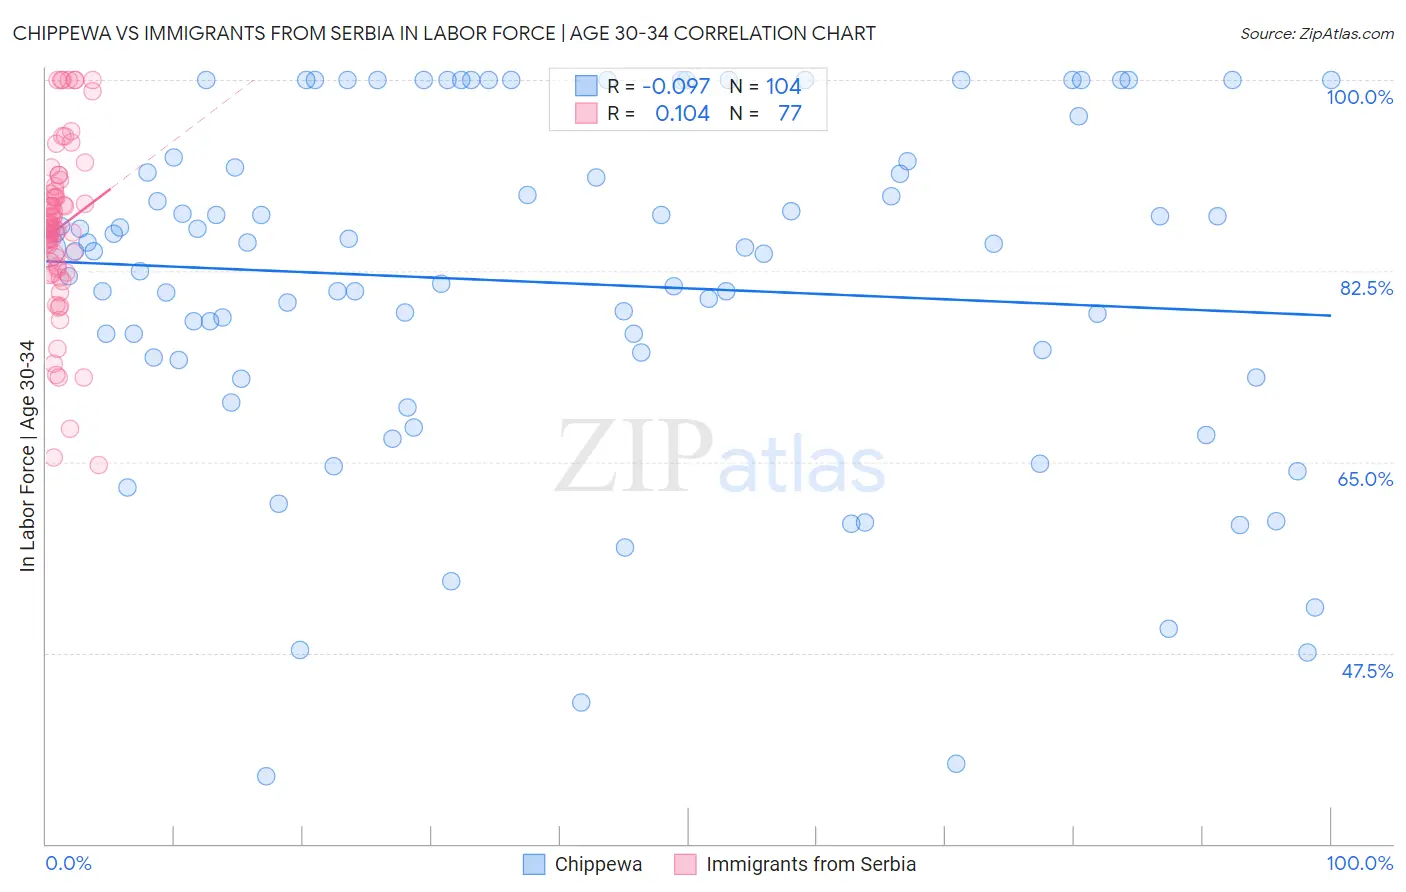
Chippewa vs Immigrants from Serbia In Labor Force | Age 30-34 Correlation Chart
The statistical analysis conducted on geographies consisting of 214,981,343 people shows a slight negative correlation between the proportion of Chippewa and labor force participation rate among population between the ages 30 and 34 in the United States with a correlation coefficient (R) of -0.097 and weighted average of 82.6%. Similarly, the statistical analysis conducted on geographies consisting of 131,692,327 people shows a poor positive correlation between the proportion of Immigrants from Serbia and labor force participation rate among population between the ages 30 and 34 in the United States with a correlation coefficient (R) of 0.104 and weighted average of 86.2%, a difference of 4.3%.
In Labor Force | Age 30-34 Correlation Summary
| Measurement | Chippewa | Immigrants from Serbia |
| Minimum | 36.2% | 64.7% |
| Maximum | 100.0% | 100.0% |
| Range | 63.8% | 35.3% |
| Mean | 81.4% | 86.5% |
| Median | 84.4% | 86.5% |
| Interquartile 25% (IQ1) | 74.4% | 82.8% |
| Interquartile 75% (IQ3) | 92.2% | 90.0% |
| Interquartile Range (IQR) | 17.8% | 7.2% |
| Standard Deviation (Sample) | 15.7% | 7.7% |
| Standard Deviation (Population) | 15.6% | 7.7% |
Similar Demographics by In Labor Force | Age 30-34
Demographics Similar to Chippewa by In Labor Force | Age 30-34
In terms of in labor force | age 30-34, the demographic groups most similar to Chippewa are Comanche (82.6%, a difference of 0.010%), Aleut (82.6%, a difference of 0.010%), Pennsylvania German (82.6%, a difference of 0.020%), American (82.7%, a difference of 0.14%), and Immigrants from Central America (82.5%, a difference of 0.14%).
| Demographics | Rating | Rank | In Labor Force | Age 30-34 |
| Hawaiians | 0.0 /100 | #289 | Tragic 83.0% |
| Blackfeet | 0.0 /100 | #290 | Tragic 82.8% |
| Potawatomi | 0.0 /100 | #291 | Tragic 82.8% |
| Blacks/African Americans | 0.0 /100 | #292 | Tragic 82.8% |
| Nepalese | 0.0 /100 | #293 | Tragic 82.7% |
| Americans | 0.0 /100 | #294 | Tragic 82.7% |
| Pennsylvania Germans | 0.0 /100 | #295 | Tragic 82.6% |
| Chippewa | 0.0 /100 | #296 | Tragic 82.6% |
| Comanche | 0.0 /100 | #297 | Tragic 82.6% |
| Aleuts | 0.0 /100 | #298 | Tragic 82.6% |
| Immigrants | Central America | 0.0 /100 | #299 | Tragic 82.5% |
| Hmong | 0.0 /100 | #300 | Tragic 82.4% |
| Hispanics or Latinos | 0.0 /100 | #301 | Tragic 82.4% |
| Ottawa | 0.0 /100 | #302 | Tragic 82.4% |
| Immigrants | Micronesia | 0.0 /100 | #303 | Tragic 82.4% |
Demographics Similar to Immigrants from Serbia by In Labor Force | Age 30-34
In terms of in labor force | age 30-34, the demographic groups most similar to Immigrants from Serbia are Carpatho Rusyn (86.2%, a difference of 0.010%), Immigrants from Somalia (86.2%, a difference of 0.040%), Cambodian (86.2%, a difference of 0.050%), Immigrants from Bolivia (86.2%, a difference of 0.060%), and Somali (86.2%, a difference of 0.070%).
| Demographics | Rating | Rank | In Labor Force | Age 30-34 |
| Immigrants | Ethiopia | 100.0 /100 | #3 | Exceptional 86.6% |
| Liberians | 100.0 /100 | #4 | Exceptional 86.4% |
| Immigrants | Ireland | 100.0 /100 | #5 | Exceptional 86.3% |
| Somalis | 100.0 /100 | #6 | Exceptional 86.2% |
| Immigrants | Bolivia | 100.0 /100 | #7 | Exceptional 86.2% |
| Cambodians | 100.0 /100 | #8 | Exceptional 86.2% |
| Immigrants | Somalia | 100.0 /100 | #9 | Exceptional 86.2% |
| Immigrants | Serbia | 100.0 /100 | #10 | Exceptional 86.2% |
| Carpatho Rusyns | 100.0 /100 | #11 | Exceptional 86.2% |
| Bolivians | 100.0 /100 | #12 | Exceptional 86.1% |
| Immigrants | Croatia | 100.0 /100 | #13 | Exceptional 86.1% |
| Immigrants | Cabo Verde | 100.0 /100 | #14 | Exceptional 86.1% |
| Immigrants | Albania | 100.0 /100 | #15 | Exceptional 86.1% |
| Latvians | 100.0 /100 | #16 | Exceptional 86.0% |
| Immigrants | Cameroon | 100.0 /100 | #17 | Exceptional 86.0% |