Bhutanese vs Nepalese In Labor Force | Age 25-29
COMPARE
Bhutanese
Nepalese
In Labor Force | Age 25-29
In Labor Force | Age 25-29 Comparison
Bhutanese
Nepalese
84.8%
IN LABOR FORCE | AGE 25-29
76.0/ 100
METRIC RATING
136th/ 347
METRIC RANK
82.9%
IN LABOR FORCE | AGE 25-29
0.0/ 100
METRIC RATING
294th/ 347
METRIC RANK
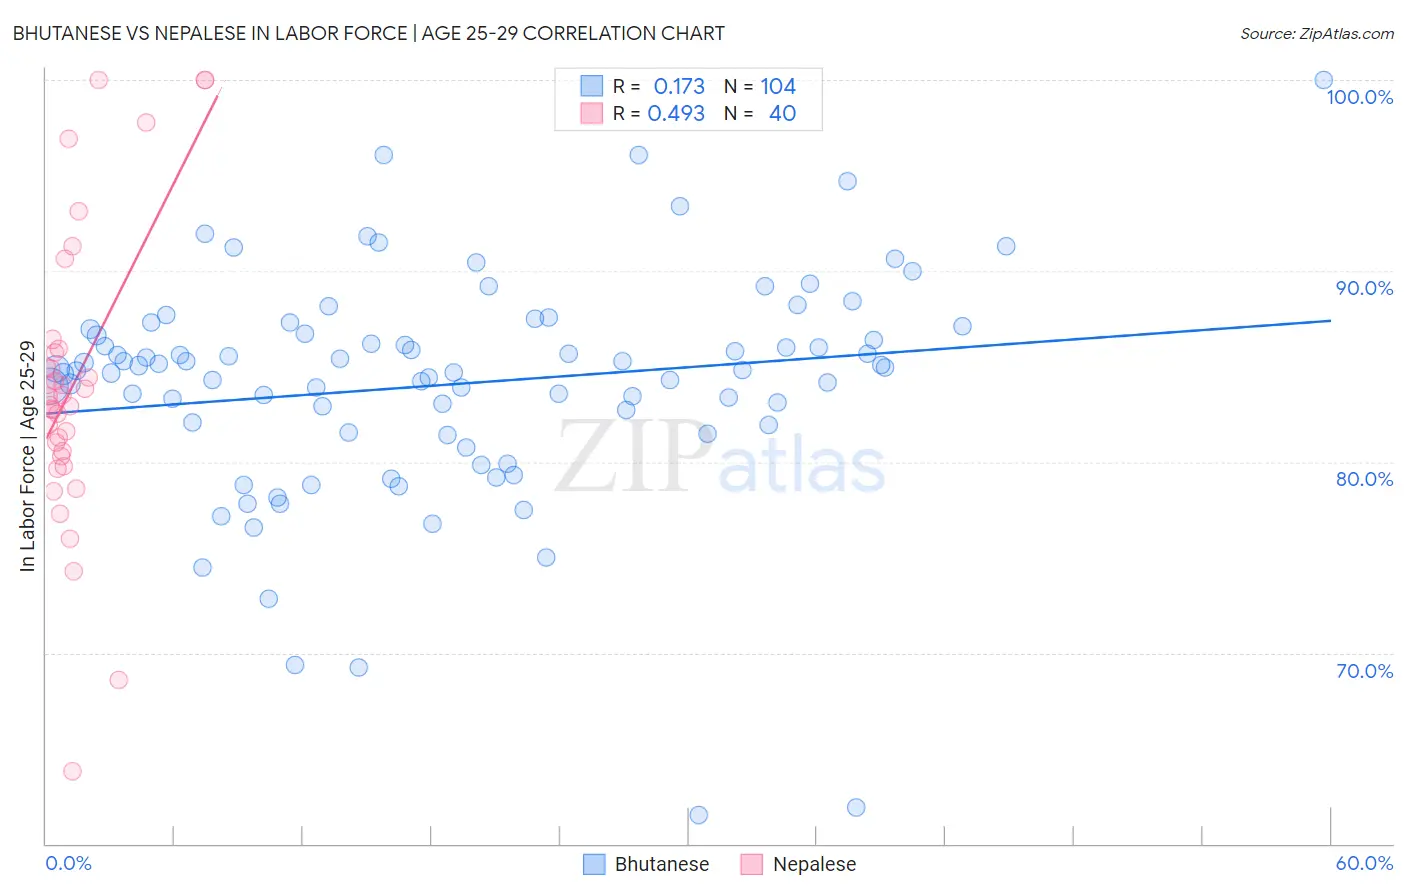
Bhutanese vs Nepalese In Labor Force | Age 25-29 Correlation Chart
The statistical analysis conducted on geographies consisting of 455,304,238 people shows a poor positive correlation between the proportion of Bhutanese and labor force participation rate among population between the ages 25 and 29 in the United States with a correlation coefficient (R) of 0.173 and weighted average of 84.8%. Similarly, the statistical analysis conducted on geographies consisting of 24,521,755 people shows a moderate positive correlation between the proportion of Nepalese and labor force participation rate among population between the ages 25 and 29 in the United States with a correlation coefficient (R) of 0.493 and weighted average of 82.9%, a difference of 2.3%.
In Labor Force | Age 25-29 Correlation Summary
| Measurement | Bhutanese | Nepalese |
| Minimum | 61.5% | 63.8% |
| Maximum | 100.0% | 100.0% |
| Range | 38.5% | 36.2% |
| Mean | 84.1% | 84.1% |
| Median | 84.8% | 83.2% |
| Interquartile 25% (IQ1) | 81.7% | 80.4% |
| Interquartile 75% (IQ3) | 86.8% | 85.8% |
| Interquartile Range (IQR) | 5.1% | 5.4% |
| Standard Deviation (Sample) | 6.0% | 7.7% |
| Standard Deviation (Population) | 6.0% | 7.6% |
Similar Demographics by In Labor Force | Age 25-29
Demographics Similar to Bhutanese by In Labor Force | Age 25-29
In terms of in labor force | age 25-29, the demographic groups most similar to Bhutanese are Immigrants from Hungary (84.8%, a difference of 0.0%), Syrian (84.8%, a difference of 0.010%), Iranian (84.8%, a difference of 0.020%), Romanian (84.8%, a difference of 0.020%), and Asian (84.8%, a difference of 0.020%).
| Demographics | Rating | Rank | In Labor Force | Age 25-29 |
| Immigrants | Russia | 81.6 /100 | #129 | Excellent 84.9% |
| Northern Europeans | 81.3 /100 | #130 | Excellent 84.9% |
| Iranians | 78.1 /100 | #131 | Good 84.8% |
| Romanians | 77.7 /100 | #132 | Good 84.8% |
| Asians | 77.7 /100 | #133 | Good 84.8% |
| Syrians | 76.5 /100 | #134 | Good 84.8% |
| Immigrants | Hungary | 76.4 /100 | #135 | Good 84.8% |
| Bhutanese | 76.0 /100 | #136 | Good 84.8% |
| Immigrants | Canada | 73.5 /100 | #137 | Good 84.8% |
| Armenians | 72.7 /100 | #138 | Good 84.8% |
| Immigrants | Eastern Asia | 72.6 /100 | #139 | Good 84.8% |
| Immigrants | North America | 72.1 /100 | #140 | Good 84.8% |
| Danes | 71.9 /100 | #141 | Good 84.8% |
| Pakistanis | 70.0 /100 | #142 | Good 84.8% |
| Sri Lankans | 69.2 /100 | #143 | Good 84.8% |
Demographics Similar to Nepalese by In Labor Force | Age 25-29
In terms of in labor force | age 25-29, the demographic groups most similar to Nepalese are Immigrants from Latin America (82.9%, a difference of 0.0%), Chippewa (82.9%, a difference of 0.0%), Immigrants from Nicaragua (82.9%, a difference of 0.0%), Potawatomi (82.9%, a difference of 0.010%), and Native Hawaiian (82.9%, a difference of 0.020%).
| Demographics | Rating | Rank | In Labor Force | Age 25-29 |
| Guyanese | 0.0 /100 | #287 | Tragic 83.0% |
| Ottawa | 0.0 /100 | #288 | Tragic 83.0% |
| Immigrants | Micronesia | 0.0 /100 | #289 | Tragic 83.0% |
| Immigrants | Bangladesh | 0.0 /100 | #290 | Tragic 83.0% |
| Hawaiians | 0.0 /100 | #291 | Tragic 83.0% |
| Immigrants | Guyana | 0.0 /100 | #292 | Tragic 83.0% |
| Immigrants | Latin America | 0.0 /100 | #293 | Tragic 82.9% |
| Nepalese | 0.0 /100 | #294 | Tragic 82.9% |
| Chippewa | 0.0 /100 | #295 | Tragic 82.9% |
| Immigrants | Nicaragua | 0.0 /100 | #296 | Tragic 82.9% |
| Potawatomi | 0.0 /100 | #297 | Tragic 82.9% |
| Native Hawaiians | 0.0 /100 | #298 | Tragic 82.9% |
| Fijians | 0.0 /100 | #299 | Tragic 82.9% |
| Spanish American Indians | 0.0 /100 | #300 | Tragic 82.9% |
| Vietnamese | 0.0 /100 | #301 | Tragic 82.8% |