Albanian vs Panamanian In Labor Force | Age 20-24
COMPARE
Albanian
Panamanian
In Labor Force | Age 20-24
In Labor Force | Age 20-24 Comparison
Albanians
Panamanians
74.6%
IN LABOR FORCE | AGE 20-24
16.2/ 100
METRIC RATING
207th/ 347
METRIC RANK
74.7%
IN LABOR FORCE | AGE 20-24
25.0/ 100
METRIC RATING
197th/ 347
METRIC RANK
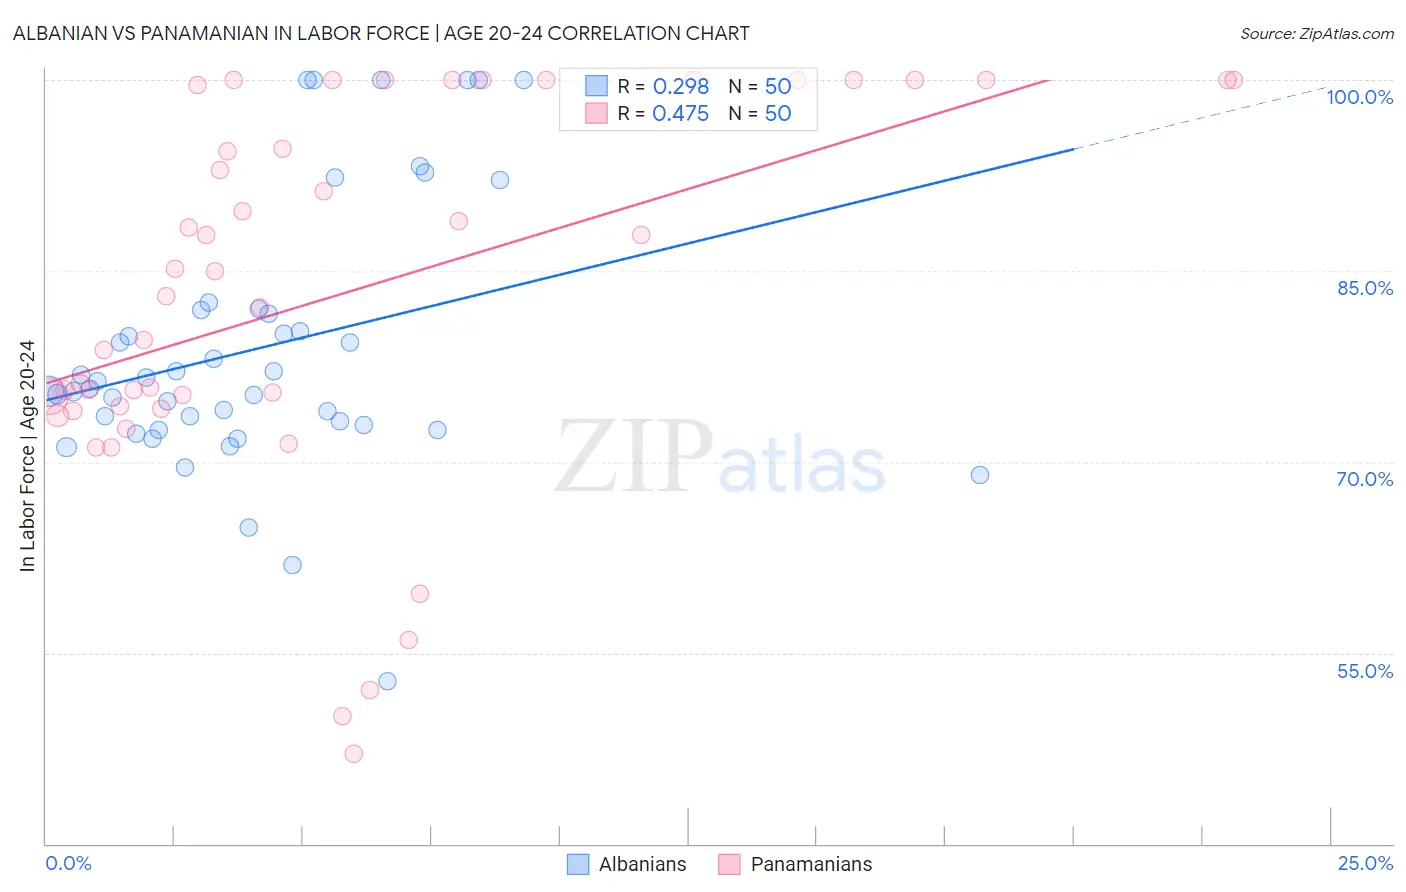
Albanian vs Panamanian In Labor Force | Age 20-24 Correlation Chart
The statistical analysis conducted on geographies consisting of 193,237,710 people shows a weak positive correlation between the proportion of Albanians and labor force participation rate among population between the ages 20 and 24 in the United States with a correlation coefficient (R) of 0.298 and weighted average of 74.6%. Similarly, the statistical analysis conducted on geographies consisting of 281,211,194 people shows a moderate positive correlation between the proportion of Panamanians and labor force participation rate among population between the ages 20 and 24 in the United States with a correlation coefficient (R) of 0.475 and weighted average of 74.7%, a difference of 0.20%.
In Labor Force | Age 20-24 Correlation Summary
| Measurement | Albanian | Panamanian |
| Minimum | 52.8% | 47.0% |
| Maximum | 100.0% | 100.0% |
| Range | 47.2% | 53.0% |
| Mean | 79.0% | 83.2% |
| Median | 76.0% | 84.0% |
| Interquartile 25% (IQ1) | 72.9% | 74.4% |
| Interquartile 75% (IQ3) | 81.9% | 100.0% |
| Interquartile Range (IQR) | 9.0% | 25.6% |
| Standard Deviation (Sample) | 10.5% | 14.7% |
| Standard Deviation (Population) | 10.4% | 14.5% |
Demographics Similar to Albanians and Panamanians by In Labor Force | Age 20-24
In terms of in labor force | age 20-24, the demographic groups most similar to Albanians are Immigrants from Uruguay (74.6%, a difference of 0.010%), Arab (74.6%, a difference of 0.010%), Sioux (74.6%, a difference of 0.030%), Uruguayan (74.6%, a difference of 0.030%), and Immigrants from Northern Africa (74.6%, a difference of 0.040%). Similarly, the demographic groups most similar to Panamanians are Immigrants from Vietnam (74.7%, a difference of 0.0%), Immigrants from Denmark (74.8%, a difference of 0.010%), Eastern European (74.8%, a difference of 0.010%), Immigrants from Nigeria (74.7%, a difference of 0.020%), and Alsatian (74.8%, a difference of 0.040%).
| Demographics | Rating | Rank | In Labor Force | Age 20-24 |
| Immigrants | Europe | 27.5 /100 | #192 | Fair 74.8% |
| Alsatians | 27.1 /100 | #193 | Fair 74.8% |
| Immigrants | Denmark | 25.8 /100 | #194 | Fair 74.8% |
| Eastern Europeans | 25.4 /100 | #195 | Fair 74.8% |
| Immigrants | Vietnam | 25.1 /100 | #196 | Fair 74.7% |
| Panamanians | 25.0 /100 | #197 | Fair 74.7% |
| Immigrants | Nigeria | 24.2 /100 | #198 | Fair 74.7% |
| Taiwanese | 23.2 /100 | #199 | Fair 74.7% |
| Nigerians | 21.9 /100 | #200 | Fair 74.7% |
| Choctaw | 21.4 /100 | #201 | Fair 74.7% |
| Moroccans | 20.4 /100 | #202 | Fair 74.7% |
| Immigrants | Northern Africa | 17.9 /100 | #203 | Poor 74.6% |
| Immigrants | Italy | 17.6 /100 | #204 | Poor 74.6% |
| Inupiat | 17.6 /100 | #205 | Poor 74.6% |
| Sioux | 17.5 /100 | #206 | Poor 74.6% |
| Albanians | 16.2 /100 | #207 | Poor 74.6% |
| Immigrants | Uruguay | 15.8 /100 | #208 | Poor 74.6% |
| Arabs | 15.8 /100 | #209 | Poor 74.6% |
| Uruguayans | 15.1 /100 | #210 | Poor 74.6% |
| Immigrants | Australia | 14.7 /100 | #211 | Poor 74.6% |
| Creek | 13.3 /100 | #212 | Poor 74.5% |