African vs Immigrants from Uruguay In Labor Force | Age 30-34
COMPARE
African
Immigrants from Uruguay
In Labor Force | Age 30-34
In Labor Force | Age 30-34 Comparison
Africans
Immigrants from Uruguay
83.4%
IN LABOR FORCE | AGE 30-34
0.0/ 100
METRIC RATING
280th/ 347
METRIC RANK
84.7%
IN LABOR FORCE | AGE 30-34
57.4/ 100
METRIC RATING
163rd/ 347
METRIC RANK
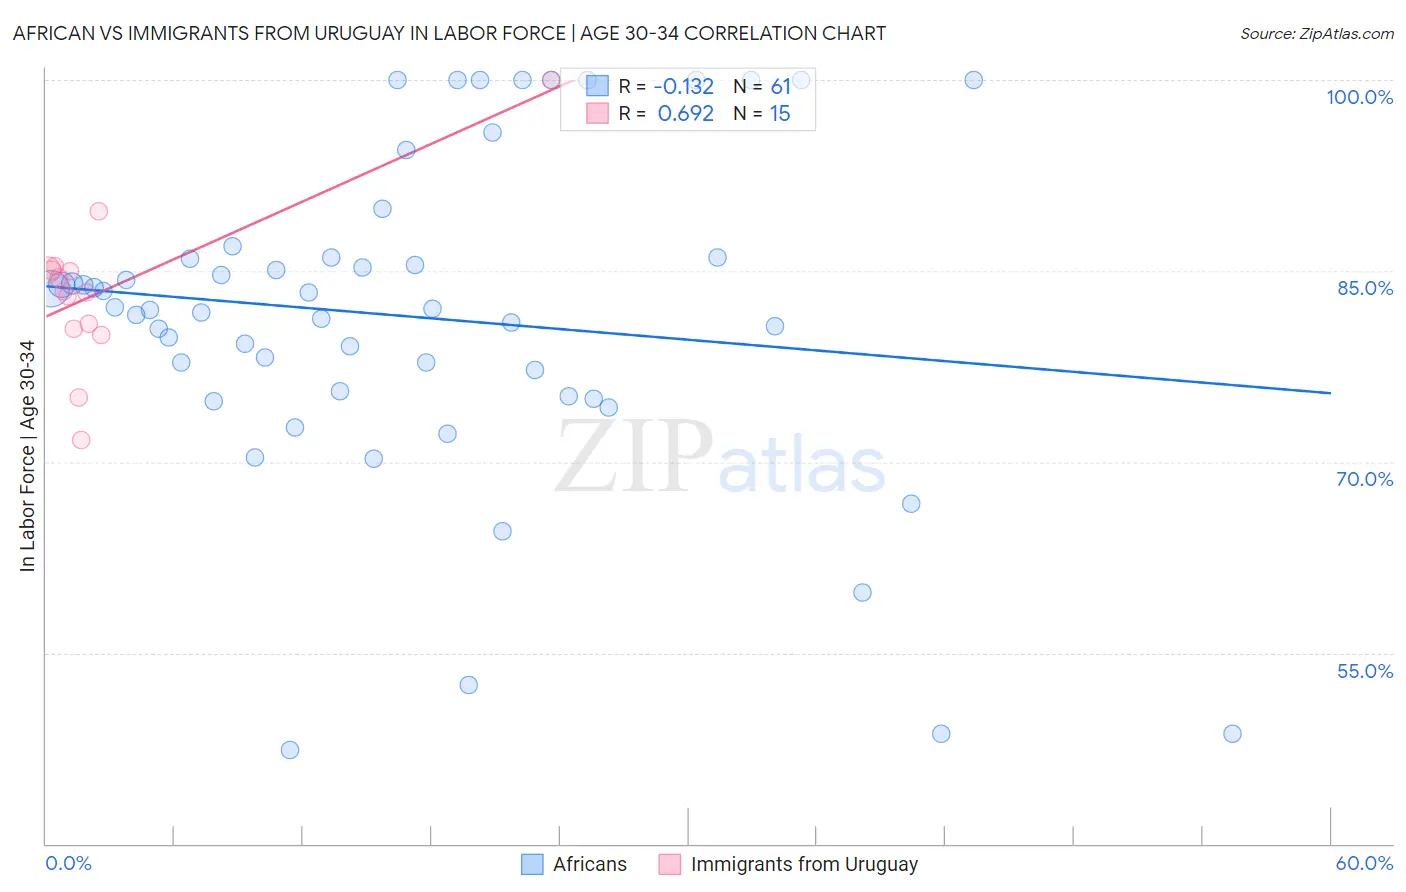
African vs Immigrants from Uruguay In Labor Force | Age 30-34 Correlation Chart
The statistical analysis conducted on geographies consisting of 469,594,480 people shows a poor negative correlation between the proportion of Africans and labor force participation rate among population between the ages 30 and 34 in the United States with a correlation coefficient (R) of -0.132 and weighted average of 83.4%. Similarly, the statistical analysis conducted on geographies consisting of 133,242,034 people shows a significant positive correlation between the proportion of Immigrants from Uruguay and labor force participation rate among population between the ages 30 and 34 in the United States with a correlation coefficient (R) of 0.692 and weighted average of 84.7%, a difference of 1.6%.
In Labor Force | Age 30-34 Correlation Summary
| Measurement | African | Immigrants from Uruguay |
| Minimum | 47.4% | 71.7% |
| Maximum | 100.0% | 100.0% |
| Range | 52.6% | 28.3% |
| Mean | 81.4% | 83.5% |
| Median | 82.1% | 83.4% |
| Interquartile 25% (IQ1) | 75.4% | 80.5% |
| Interquartile 75% (IQ3) | 86.1% | 85.1% |
| Interquartile Range (IQR) | 10.7% | 4.6% |
| Standard Deviation (Sample) | 12.9% | 6.3% |
| Standard Deviation (Population) | 12.7% | 6.1% |
Similar Demographics by In Labor Force | Age 30-34
Demographics Similar to Africans by In Labor Force | Age 30-34
In terms of in labor force | age 30-34, the demographic groups most similar to Africans are Immigrants from Fiji (83.4%, a difference of 0.030%), Fijian (83.4%, a difference of 0.040%), Delaware (83.5%, a difference of 0.10%), Immigrants from Grenada (83.5%, a difference of 0.12%), and Tongan (83.5%, a difference of 0.12%).
| Demographics | Rating | Rank | In Labor Force | Age 30-34 |
| Guamanians/Chamorros | 0.0 /100 | #273 | Tragic 83.5% |
| Belizeans | 0.0 /100 | #274 | Tragic 83.5% |
| Immigrants | Grenada | 0.0 /100 | #275 | Tragic 83.5% |
| Tongans | 0.0 /100 | #276 | Tragic 83.5% |
| Delaware | 0.0 /100 | #277 | Tragic 83.5% |
| Fijians | 0.0 /100 | #278 | Tragic 83.4% |
| Immigrants | Fiji | 0.0 /100 | #279 | Tragic 83.4% |
| Africans | 0.0 /100 | #280 | Tragic 83.4% |
| Samoans | 0.0 /100 | #281 | Tragic 83.3% |
| Mexican American Indians | 0.0 /100 | #282 | Tragic 83.2% |
| Assyrians/Chaldeans/Syriacs | 0.0 /100 | #283 | Tragic 83.2% |
| Immigrants | Belize | 0.0 /100 | #284 | Tragic 83.2% |
| Cree | 0.0 /100 | #285 | Tragic 83.2% |
| Immigrants | Latin America | 0.0 /100 | #286 | Tragic 83.1% |
| Native Hawaiians | 0.0 /100 | #287 | Tragic 83.0% |
Demographics Similar to Immigrants from Uruguay by In Labor Force | Age 30-34
In terms of in labor force | age 30-34, the demographic groups most similar to Immigrants from Uruguay are Icelander (84.7%, a difference of 0.0%), South American (84.7%, a difference of 0.010%), Immigrants from Western Europe (84.7%, a difference of 0.010%), Pakistani (84.7%, a difference of 0.020%), and Immigrants from Cambodia (84.7%, a difference of 0.020%).
| Demographics | Rating | Rank | In Labor Force | Age 30-34 |
| French Canadians | 67.3 /100 | #156 | Good 84.8% |
| Peruvians | 65.9 /100 | #157 | Good 84.8% |
| Immigrants | Armenia | 64.7 /100 | #158 | Good 84.8% |
| Czechoslovakians | 63.0 /100 | #159 | Good 84.8% |
| Pakistanis | 60.8 /100 | #160 | Good 84.7% |
| Immigrants | Cambodia | 60.7 /100 | #161 | Good 84.7% |
| South Americans | 58.7 /100 | #162 | Average 84.7% |
| Immigrants | Uruguay | 57.4 /100 | #163 | Average 84.7% |
| Icelanders | 56.8 /100 | #164 | Average 84.7% |
| Immigrants | Western Europe | 56.7 /100 | #165 | Average 84.7% |
| Afghans | 55.2 /100 | #166 | Average 84.7% |
| Immigrants | South Eastern Asia | 54.2 /100 | #167 | Average 84.7% |
| Immigrants | Peru | 52.4 /100 | #168 | Average 84.7% |
| South American Indians | 52.1 /100 | #169 | Average 84.7% |
| Immigrants | Burma/Myanmar | 52.0 /100 | #170 | Average 84.7% |