Yakama vs Costa Rican Householder Income Ages 25 - 44 years
COMPARE
Yakama
Costa Rican
Householder Income Ages 25 - 44 years
Householder Income Ages 25 - 44 years Comparison
Yakama
Costa Ricans
$76,226
HOUSEHOLDER INCOME AGES 25 - 44 YEARS
0.0/ 100
METRIC RATING
330th/ 347
METRIC RANK
$95,565
HOUSEHOLDER INCOME AGES 25 - 44 YEARS
63.5/ 100
METRIC RATING
159th/ 347
METRIC RANK
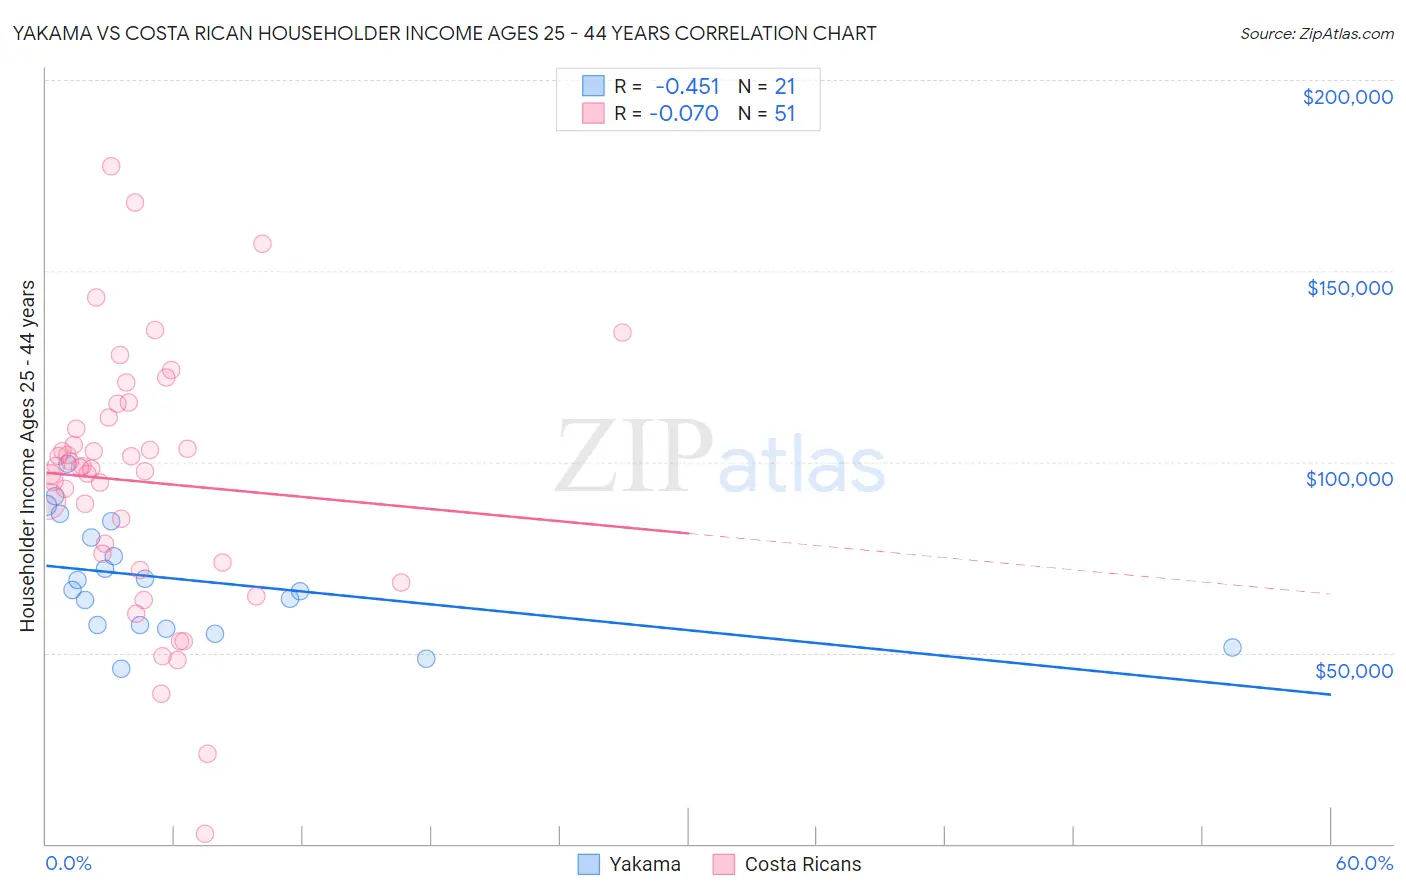
Yakama vs Costa Rican Householder Income Ages 25 - 44 years Correlation Chart
The statistical analysis conducted on geographies consisting of 19,902,143 people shows a moderate negative correlation between the proportion of Yakama and household income with householder between the ages 25 and 44 in the United States with a correlation coefficient (R) of -0.451 and weighted average of $76,226. Similarly, the statistical analysis conducted on geographies consisting of 253,116,835 people shows a slight negative correlation between the proportion of Costa Ricans and household income with householder between the ages 25 and 44 in the United States with a correlation coefficient (R) of -0.070 and weighted average of $95,565, a difference of 25.4%.
Householder Income Ages 25 - 44 years Correlation Summary
| Measurement | Yakama | Costa Rican |
| Minimum | $45,972 | $2,499 |
| Maximum | $99,532 | $177,312 |
| Range | $53,560 | $174,813 |
| Mean | $68,963 | $94,845 |
| Median | $66,512 | $98,440 |
| Interquartile 25% (IQ1) | $56,733 | $73,523 |
| Interquartile 75% (IQ3) | $82,417 | $111,609 |
| Interquartile Range (IQR) | $25,684 | $38,086 |
| Standard Deviation (Sample) | $14,961 | $33,692 |
| Standard Deviation (Population) | $14,600 | $33,360 |
Similar Demographics by Householder Income Ages 25 - 44 years
Demographics Similar to Yakama by Householder Income Ages 25 - 44 years
In terms of householder income ages 25 - 44 years, the demographic groups most similar to Yakama are Seminole ($76,584, a difference of 0.47%), Immigrants from Cuba ($76,701, a difference of 0.62%), Native/Alaskan ($75,647, a difference of 0.76%), Immigrants from Bahamas ($76,910, a difference of 0.90%), and Houma ($77,044, a difference of 1.1%).
| Demographics | Rating | Rank | Householder Income Ages 25 - 44 years |
| Immigrants | Honduras | 0.0 /100 | #323 | Tragic $77,328 |
| Dutch West Indians | 0.0 /100 | #324 | Tragic $77,260 |
| Sioux | 0.0 /100 | #325 | Tragic $77,089 |
| Houma | 0.0 /100 | #326 | Tragic $77,044 |
| Immigrants | Bahamas | 0.0 /100 | #327 | Tragic $76,910 |
| Immigrants | Cuba | 0.0 /100 | #328 | Tragic $76,701 |
| Seminole | 0.0 /100 | #329 | Tragic $76,584 |
| Yakama | 0.0 /100 | #330 | Tragic $76,226 |
| Natives/Alaskans | 0.0 /100 | #331 | Tragic $75,647 |
| Bahamians | 0.0 /100 | #332 | Tragic $75,395 |
| Hopi | 0.0 /100 | #333 | Tragic $75,002 |
| Creek | 0.0 /100 | #334 | Tragic $74,847 |
| Kiowa | 0.0 /100 | #335 | Tragic $74,776 |
| Yup'ik | 0.0 /100 | #336 | Tragic $73,688 |
| Blacks/African Americans | 0.0 /100 | #337 | Tragic $73,370 |
Demographics Similar to Costa Ricans by Householder Income Ages 25 - 44 years
In terms of householder income ages 25 - 44 years, the demographic groups most similar to Costa Ricans are Icelander ($95,560, a difference of 0.010%), Scandinavian ($95,596, a difference of 0.030%), Immigrants from Portugal ($95,512, a difference of 0.060%), Swiss ($95,511, a difference of 0.060%), and Immigrants from Saudi Arabia ($95,450, a difference of 0.12%).
| Demographics | Rating | Rank | Householder Income Ages 25 - 44 years |
| South American Indians | 74.5 /100 | #152 | Good $96,497 |
| Slovenes | 73.9 /100 | #153 | Good $96,439 |
| Slavs | 73.2 /100 | #154 | Good $96,377 |
| Moroccans | 70.3 /100 | #155 | Good $96,117 |
| Immigrants | Germany | 67.9 /100 | #156 | Good $95,913 |
| Immigrants | Uganda | 65.2 /100 | #157 | Good $95,698 |
| Scandinavians | 63.9 /100 | #158 | Good $95,596 |
| Costa Ricans | 63.5 /100 | #159 | Good $95,565 |
| Icelanders | 63.4 /100 | #160 | Good $95,560 |
| Immigrants | Portugal | 62.8 /100 | #161 | Good $95,512 |
| Swiss | 62.8 /100 | #162 | Good $95,511 |
| Immigrants | Saudi Arabia | 62.0 /100 | #163 | Good $95,450 |
| South Americans | 60.9 /100 | #164 | Good $95,362 |
| Immigrants | Nepal | 60.3 /100 | #165 | Good $95,322 |
| Immigrants | Ethiopia | 59.5 /100 | #166 | Average $95,256 |