Welsh vs Barbadian Householder Income Under 25 years
COMPARE
Welsh
Barbadian
Householder Income Under 25 years
Householder Income Under 25 years Comparison
Welsh
Barbadians
$50,597
HOUSEHOLDER INCOME UNDER 25 YEARS
2.0/ 100
METRIC RATING
246th/ 347
METRIC RANK
$52,202
HOUSEHOLDER INCOME UNDER 25 YEARS
50.8/ 100
METRIC RATING
173rd/ 347
METRIC RANK
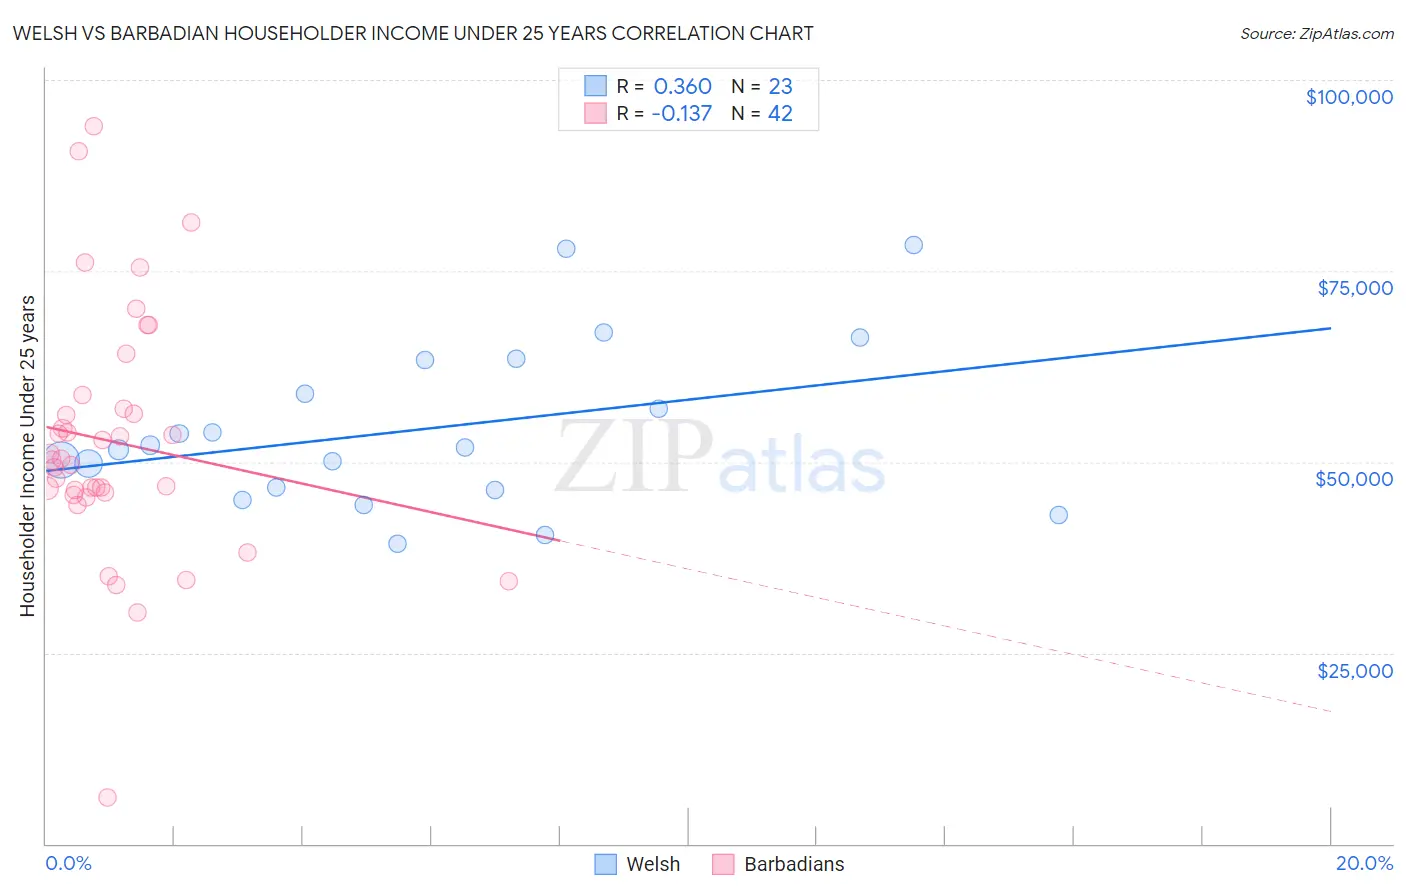
Welsh vs Barbadian Householder Income Under 25 years Correlation Chart
The statistical analysis conducted on geographies consisting of 418,128,856 people shows a mild positive correlation between the proportion of Welsh and household income with householder under the age of 25 in the United States with a correlation coefficient (R) of 0.360 and weighted average of $50,597. Similarly, the statistical analysis conducted on geographies consisting of 127,855,739 people shows a poor negative correlation between the proportion of Barbadians and household income with householder under the age of 25 in the United States with a correlation coefficient (R) of -0.137 and weighted average of $52,202, a difference of 3.2%.
Householder Income Under 25 years Correlation Summary
| Measurement | Welsh | Barbadian |
| Minimum | $39,341 | $6,042 |
| Maximum | $78,342 | $93,896 |
| Range | $39,001 | $87,854 |
| Mean | $54,354 | $52,601 |
| Median | $51,818 | $50,291 |
| Interquartile 25% (IQ1) | $46,242 | $46,014 |
| Interquartile 75% (IQ3) | $63,259 | $56,899 |
| Interquartile Range (IQR) | $17,017 | $10,884 |
| Standard Deviation (Sample) | $10,784 | $16,179 |
| Standard Deviation (Population) | $10,547 | $15,986 |
Similar Demographics by Householder Income Under 25 years
Demographics Similar to Welsh by Householder Income Under 25 years
In terms of householder income under 25 years, the demographic groups most similar to Welsh are Immigrants from Africa ($50,609, a difference of 0.020%), Marshallese ($50,627, a difference of 0.060%), Immigrants from Bosnia and Herzegovina ($50,565, a difference of 0.060%), Slavic ($50,563, a difference of 0.070%), and Scottish ($50,554, a difference of 0.090%).
| Demographics | Rating | Rank | Householder Income Under 25 years |
| Immigrants | Caribbean | 2.9 /100 | #239 | Tragic $50,757 |
| Immigrants | Lebanon | 2.7 /100 | #240 | Tragic $50,729 |
| Immigrants | Micronesia | 2.5 /100 | #241 | Tragic $50,691 |
| Cubans | 2.3 /100 | #242 | Tragic $50,655 |
| Immigrants | Thailand | 2.2 /100 | #243 | Tragic $50,645 |
| Marshallese | 2.1 /100 | #244 | Tragic $50,627 |
| Immigrants | Africa | 2.0 /100 | #245 | Tragic $50,609 |
| Welsh | 2.0 /100 | #246 | Tragic $50,597 |
| Immigrants | Bosnia and Herzegovina | 1.8 /100 | #247 | Tragic $50,565 |
| Slavs | 1.8 /100 | #248 | Tragic $50,563 |
| Scottish | 1.8 /100 | #249 | Tragic $50,554 |
| Immigrants | Cabo Verde | 1.7 /100 | #250 | Tragic $50,520 |
| Celtics | 1.4 /100 | #251 | Tragic $50,447 |
| Immigrants | Mexico | 1.3 /100 | #252 | Tragic $50,422 |
| Immigrants | Haiti | 1.2 /100 | #253 | Tragic $50,398 |
Demographics Similar to Barbadians by Householder Income Under 25 years
In terms of householder income under 25 years, the demographic groups most similar to Barbadians are Cypriot ($52,209, a difference of 0.010%), Immigrants from Western Asia ($52,190, a difference of 0.020%), Immigrants from Uruguay ($52,302, a difference of 0.19%), Israeli ($52,335, a difference of 0.25%), and Canadian ($52,336, a difference of 0.26%).
| Demographics | Rating | Rank | Householder Income Under 25 years |
| Immigrants | Austria | 62.6 /100 | #166 | Good $52,400 |
| Immigrants | Uganda | 61.1 /100 | #167 | Good $52,374 |
| Japanese | 60.5 /100 | #168 | Good $52,365 |
| Canadians | 58.8 /100 | #169 | Average $52,336 |
| Israelis | 58.8 /100 | #170 | Average $52,335 |
| Immigrants | Uruguay | 56.8 /100 | #171 | Average $52,302 |
| Cypriots | 51.2 /100 | #172 | Average $52,209 |
| Barbadians | 50.8 /100 | #173 | Average $52,202 |
| Immigrants | Western Asia | 50.0 /100 | #174 | Average $52,190 |
| Immigrants | Zimbabwe | 33.8 /100 | #175 | Fair $51,914 |
| Austrians | 32.9 /100 | #176 | Fair $51,898 |
| British West Indians | 30.0 /100 | #177 | Fair $51,844 |
| Finns | 29.2 /100 | #178 | Fair $51,827 |
| Basques | 28.7 /100 | #179 | Fair $51,818 |
| Immigrants | England | 28.7 /100 | #180 | Fair $51,817 |