Venezuelan vs Immigrants from Malaysia Median Earnings
COMPARE
Venezuelan
Immigrants from Malaysia
Median Earnings
Median Earnings Comparison
Venezuelans
Immigrants from Malaysia
$44,580
MEDIAN EARNINGS
6.9/ 100
METRIC RATING
235th/ 347
METRIC RANK
$52,514
MEDIAN EARNINGS
100.0/ 100
METRIC RATING
43rd/ 347
METRIC RANK
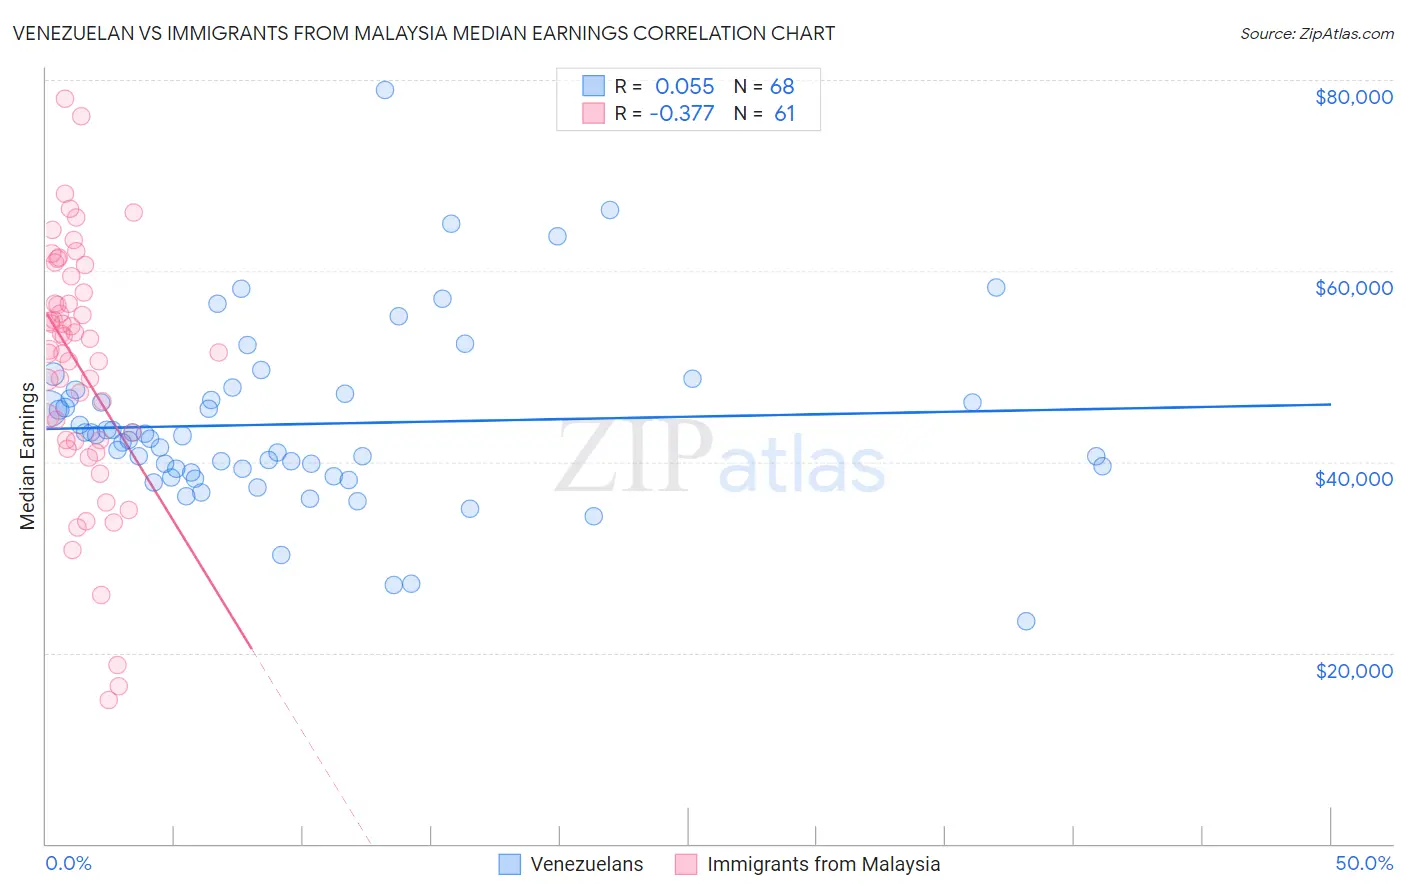
Venezuelan vs Immigrants from Malaysia Median Earnings Correlation Chart
The statistical analysis conducted on geographies consisting of 306,328,741 people shows a slight positive correlation between the proportion of Venezuelans and median earnings in the United States with a correlation coefficient (R) of 0.055 and weighted average of $44,580. Similarly, the statistical analysis conducted on geographies consisting of 197,951,300 people shows a mild negative correlation between the proportion of Immigrants from Malaysia and median earnings in the United States with a correlation coefficient (R) of -0.377 and weighted average of $52,514, a difference of 17.8%.
Median Earnings Correlation Summary
| Measurement | Venezuelan | Immigrants from Malaysia |
| Minimum | $23,314 | $15,000 |
| Maximum | $78,969 | $78,075 |
| Range | $55,655 | $63,075 |
| Mean | $43,969 | $49,921 |
| Median | $42,571 | $51,741 |
| Interquartile 25% (IQ1) | $39,048 | $42,220 |
| Interquartile 75% (IQ3) | $46,866 | $58,605 |
| Interquartile Range (IQR) | $7,818 | $16,385 |
| Standard Deviation (Sample) | $9,261 | $13,176 |
| Standard Deviation (Population) | $9,192 | $13,067 |
Similar Demographics by Median Earnings
Demographics Similar to Venezuelans by Median Earnings
In terms of median earnings, the demographic groups most similar to Venezuelans are British West Indian ($44,552, a difference of 0.060%), Cape Verdean ($44,640, a difference of 0.14%), Immigrants from Ecuador ($44,462, a difference of 0.27%), Sudanese ($44,419, a difference of 0.36%), and Immigrants from Sudan ($44,767, a difference of 0.42%).
| Demographics | Rating | Rank | Median Earnings |
| Immigrants | Iraq | 11.6 /100 | #228 | Poor $44,988 |
| Scotch-Irish | 10.7 /100 | #229 | Poor $44,924 |
| Immigrants | Western Africa | 10.3 /100 | #230 | Poor $44,893 |
| Japanese | 9.5 /100 | #231 | Tragic $44,825 |
| Delaware | 9.0 /100 | #232 | Tragic $44,783 |
| Immigrants | Sudan | 8.8 /100 | #233 | Tragic $44,767 |
| Cape Verdeans | 7.5 /100 | #234 | Tragic $44,640 |
| Venezuelans | 6.9 /100 | #235 | Tragic $44,580 |
| British West Indians | 6.7 /100 | #236 | Tragic $44,552 |
| Immigrants | Ecuador | 5.9 /100 | #237 | Tragic $44,462 |
| Sudanese | 5.6 /100 | #238 | Tragic $44,419 |
| Senegalese | 5.3 /100 | #239 | Tragic $44,373 |
| Aleuts | 4.4 /100 | #240 | Tragic $44,241 |
| Samoans | 4.2 /100 | #241 | Tragic $44,206 |
| Immigrants | Venezuela | 4.0 /100 | #242 | Tragic $44,163 |
Demographics Similar to Immigrants from Malaysia by Median Earnings
In terms of median earnings, the demographic groups most similar to Immigrants from Malaysia are Bulgarian ($52,512, a difference of 0.0%), Maltese ($52,526, a difference of 0.020%), Immigrants from Czechoslovakia ($52,361, a difference of 0.29%), Bhutanese ($52,297, a difference of 0.41%), and Australian ($52,294, a difference of 0.42%).
| Demographics | Rating | Rank | Median Earnings |
| Immigrants | Denmark | 100.0 /100 | #36 | Exceptional $53,186 |
| Immigrants | Belarus | 100.0 /100 | #37 | Exceptional $53,043 |
| Latvians | 100.0 /100 | #38 | Exceptional $53,001 |
| Immigrants | Turkey | 100.0 /100 | #39 | Exceptional $52,960 |
| Israelis | 100.0 /100 | #40 | Exceptional $52,937 |
| Immigrants | Lithuania | 100.0 /100 | #41 | Exceptional $52,769 |
| Maltese | 100.0 /100 | #42 | Exceptional $52,526 |
| Immigrants | Malaysia | 100.0 /100 | #43 | Exceptional $52,514 |
| Bulgarians | 100.0 /100 | #44 | Exceptional $52,512 |
| Immigrants | Czechoslovakia | 100.0 /100 | #45 | Exceptional $52,361 |
| Bhutanese | 100.0 /100 | #46 | Exceptional $52,297 |
| Australians | 100.0 /100 | #47 | Exceptional $52,294 |
| Immigrants | Europe | 100.0 /100 | #48 | Exceptional $52,195 |
| Bolivians | 100.0 /100 | #49 | Exceptional $52,005 |
| Immigrants | South Africa | 100.0 /100 | #50 | Exceptional $51,850 |