Turkish vs Canadian Householder Income Under 25 years
COMPARE
Turkish
Canadian
Householder Income Under 25 years
Householder Income Under 25 years Comparison
Turks
Canadians
$54,266
HOUSEHOLDER INCOME UNDER 25 YEARS
99.4/ 100
METRIC RATING
90th/ 347
METRIC RANK
$52,336
HOUSEHOLDER INCOME UNDER 25 YEARS
58.8/ 100
METRIC RATING
169th/ 347
METRIC RANK
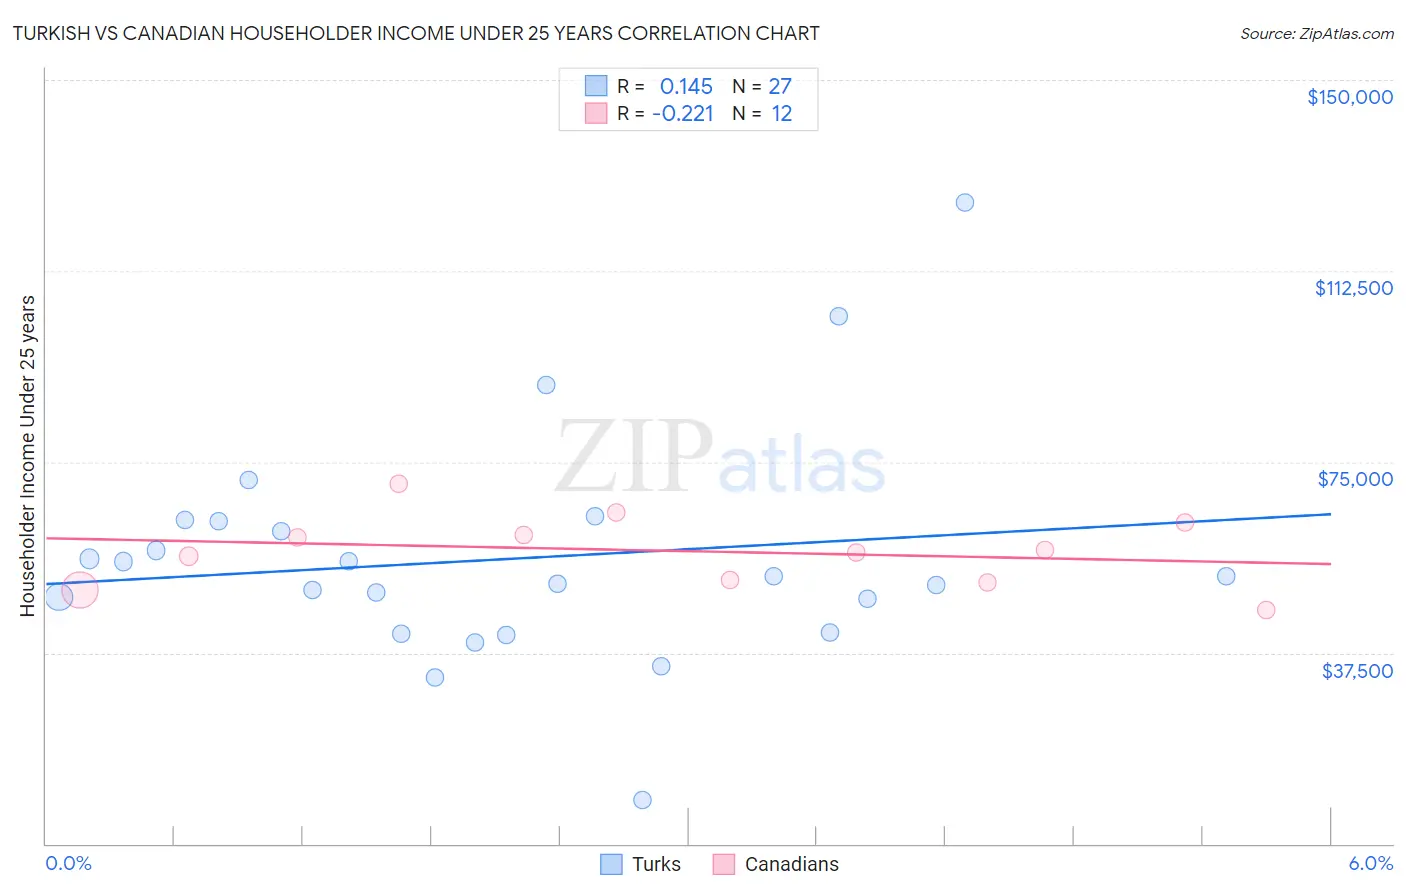
Turkish vs Canadian Householder Income Under 25 years Correlation Chart
The statistical analysis conducted on geographies consisting of 234,402,010 people shows a poor positive correlation between the proportion of Turks and household income with householder under the age of 25 in the United States with a correlation coefficient (R) of 0.145 and weighted average of $54,266. Similarly, the statistical analysis conducted on geographies consisting of 362,146,468 people shows a weak negative correlation between the proportion of Canadians and household income with householder under the age of 25 in the United States with a correlation coefficient (R) of -0.221 and weighted average of $52,336, a difference of 3.7%.
Householder Income Under 25 years Correlation Summary
| Measurement | Turkish | Canadian |
| Minimum | $8,508 | $45,833 |
| Maximum | $125,890 | $70,623 |
| Range | $117,382 | $24,790 |
| Mean | $55,917 | $57,498 |
| Median | $52,500 | $57,522 |
| Interquartile 25% (IQ1) | $41,438 | $51,515 |
| Interquartile 75% (IQ3) | $63,275 | $61,958 |
| Interquartile Range (IQR) | $21,837 | $10,443 |
| Standard Deviation (Sample) | $22,543 | $7,030 |
| Standard Deviation (Population) | $22,121 | $6,730 |
Similar Demographics by Householder Income Under 25 years
Demographics Similar to Turks by Householder Income Under 25 years
In terms of householder income under 25 years, the demographic groups most similar to Turks are Immigrants from South America ($54,268, a difference of 0.0%), Immigrants from Egypt ($54,239, a difference of 0.050%), Immigrants from St. Vincent and the Grenadines ($54,230, a difference of 0.070%), Yakama ($54,321, a difference of 0.10%), and Immigrants from Argentina ($54,209, a difference of 0.10%).
| Demographics | Rating | Rank | Householder Income Under 25 years |
| Laotians | 99.5 /100 | #83 | Exceptional $54,369 |
| Bulgarians | 99.5 /100 | #84 | Exceptional $54,352 |
| Immigrants | Czechoslovakia | 99.5 /100 | #85 | Exceptional $54,352 |
| Immigrants | Croatia | 99.5 /100 | #86 | Exceptional $54,343 |
| Brazilians | 99.5 /100 | #87 | Exceptional $54,335 |
| Yakama | 99.5 /100 | #88 | Exceptional $54,321 |
| Immigrants | South America | 99.4 /100 | #89 | Exceptional $54,268 |
| Turks | 99.4 /100 | #90 | Exceptional $54,266 |
| Immigrants | Egypt | 99.3 /100 | #91 | Exceptional $54,239 |
| Immigrants | St. Vincent and the Grenadines | 99.3 /100 | #92 | Exceptional $54,230 |
| Immigrants | Argentina | 99.3 /100 | #93 | Exceptional $54,209 |
| Immigrants | Sierra Leone | 99.3 /100 | #94 | Exceptional $54,190 |
| Immigrants | Malaysia | 99.2 /100 | #95 | Exceptional $54,179 |
| Argentineans | 99.2 /100 | #96 | Exceptional $54,154 |
| Immigrants | Portugal | 99.1 /100 | #97 | Exceptional $54,105 |
Demographics Similar to Canadians by Householder Income Under 25 years
In terms of householder income under 25 years, the demographic groups most similar to Canadians are Israeli ($52,335, a difference of 0.0%), Japanese ($52,365, a difference of 0.060%), Immigrants from Uganda ($52,374, a difference of 0.070%), Immigrants from Uruguay ($52,302, a difference of 0.070%), and Immigrants from Austria ($52,400, a difference of 0.12%).
| Demographics | Rating | Rank | Householder Income Under 25 years |
| Immigrants | Cambodia | 65.4 /100 | #162 | Good $52,450 |
| Immigrants | Chile | 64.8 /100 | #163 | Good $52,440 |
| Immigrants | Trinidad and Tobago | 64.7 /100 | #164 | Good $52,437 |
| Poles | 63.0 /100 | #165 | Good $52,407 |
| Immigrants | Austria | 62.6 /100 | #166 | Good $52,400 |
| Immigrants | Uganda | 61.1 /100 | #167 | Good $52,374 |
| Japanese | 60.5 /100 | #168 | Good $52,365 |
| Canadians | 58.8 /100 | #169 | Average $52,336 |
| Israelis | 58.8 /100 | #170 | Average $52,335 |
| Immigrants | Uruguay | 56.8 /100 | #171 | Average $52,302 |
| Cypriots | 51.2 /100 | #172 | Average $52,209 |
| Barbadians | 50.8 /100 | #173 | Average $52,202 |
| Immigrants | Western Asia | 50.0 /100 | #174 | Average $52,190 |
| Immigrants | Zimbabwe | 33.8 /100 | #175 | Fair $51,914 |
| Austrians | 32.9 /100 | #176 | Fair $51,898 |