Thai vs Immigrants from North America Per Capita Income
COMPARE
Thai
Immigrants from North America
Per Capita Income
Per Capita Income Comparison
Thais
Immigrants from North America
$54,307
PER CAPITA INCOME
100.0/ 100
METRIC RATING
18th/ 347
METRIC RANK
$49,302
PER CAPITA INCOME
99.8/ 100
METRIC RATING
73rd/ 347
METRIC RANK
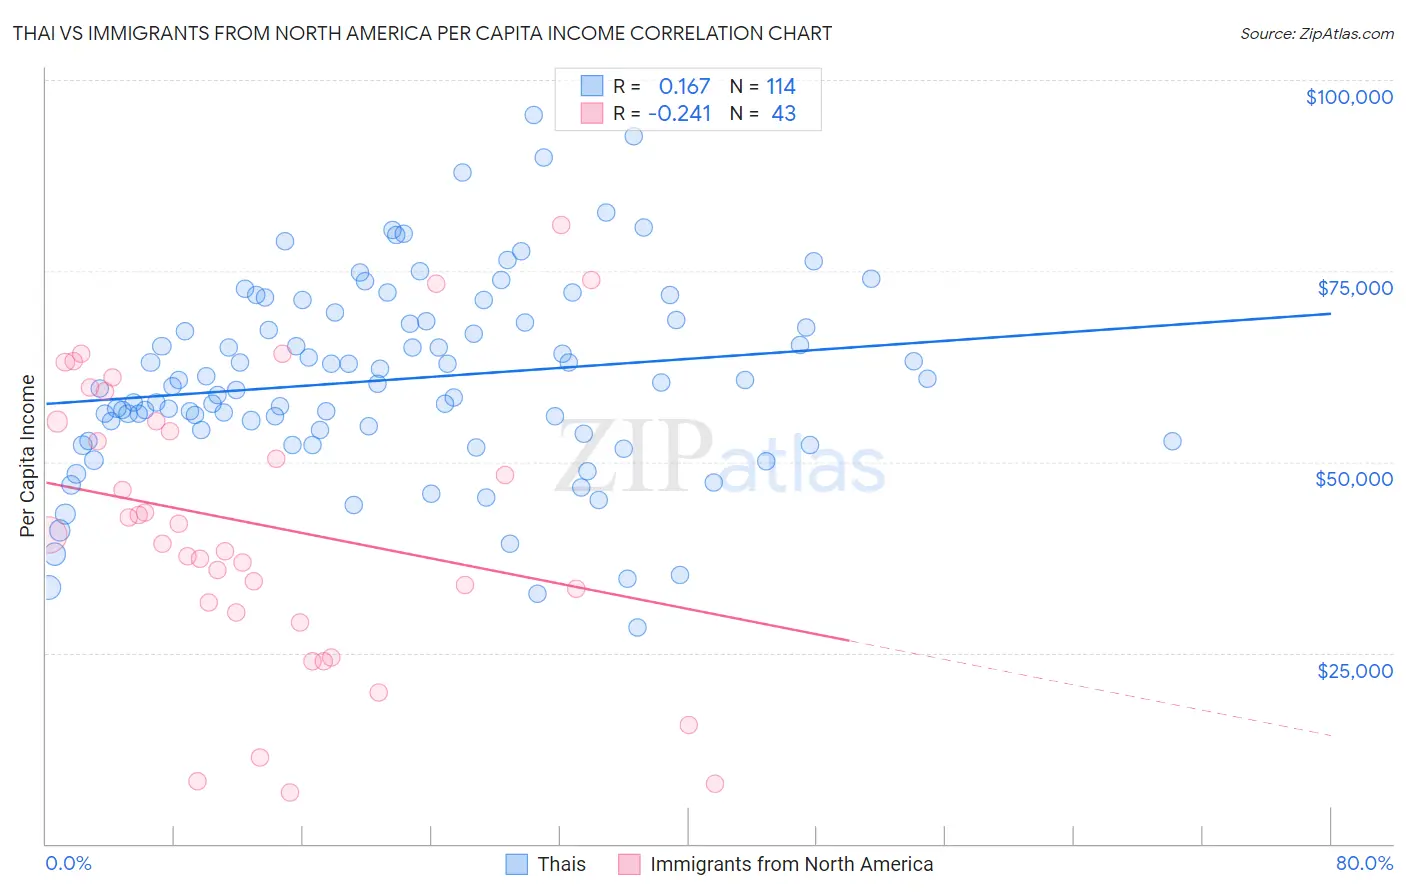
Thai vs Immigrants from North America Per Capita Income Correlation Chart
The statistical analysis conducted on geographies consisting of 475,818,965 people shows a poor positive correlation between the proportion of Thais and per capita income in the United States with a correlation coefficient (R) of 0.167 and weighted average of $54,307. Similarly, the statistical analysis conducted on geographies consisting of 462,474,558 people shows a weak negative correlation between the proportion of Immigrants from North America and per capita income in the United States with a correlation coefficient (R) of -0.241 and weighted average of $49,302, a difference of 10.2%.
Per Capita Income Correlation Summary
| Measurement | Thai | Immigrants from North America |
| Minimum | $28,291 | $6,700 |
| Maximum | $95,364 | $80,940 |
| Range | $67,073 | $74,240 |
| Mean | $60,793 | $41,767 |
| Median | $60,110 | $40,404 |
| Interquartile 25% (IQ1) | $53,762 | $30,302 |
| Interquartile 75% (IQ3) | $68,395 | $55,294 |
| Interquartile Range (IQR) | $14,633 | $24,991 |
| Standard Deviation (Sample) | $12,693 | $18,582 |
| Standard Deviation (Population) | $12,637 | $18,365 |
Similar Demographics by Per Capita Income
Demographics Similar to Thais by Per Capita Income
In terms of per capita income, the demographic groups most similar to Thais are Immigrants from China ($54,264, a difference of 0.080%), Soviet Union ($54,202, a difference of 0.19%), Immigrants from Northern Europe ($54,159, a difference of 0.27%), Immigrants from France ($54,557, a difference of 0.46%), and Indian (Asian) ($53,874, a difference of 0.80%).
| Demographics | Rating | Rank | Per Capita Income |
| Eastern Europeans | 100.0 /100 | #11 | Exceptional $55,780 |
| Immigrants | Sweden | 100.0 /100 | #12 | Exceptional $55,582 |
| Immigrants | India | 100.0 /100 | #13 | Exceptional $55,268 |
| Immigrants | Belgium | 100.0 /100 | #14 | Exceptional $55,082 |
| Cypriots | 100.0 /100 | #15 | Exceptional $54,899 |
| Immigrants | Switzerland | 100.0 /100 | #16 | Exceptional $54,866 |
| Immigrants | France | 100.0 /100 | #17 | Exceptional $54,557 |
| Thais | 100.0 /100 | #18 | Exceptional $54,307 |
| Immigrants | China | 100.0 /100 | #19 | Exceptional $54,264 |
| Soviet Union | 100.0 /100 | #20 | Exceptional $54,202 |
| Immigrants | Northern Europe | 100.0 /100 | #21 | Exceptional $54,159 |
| Indians (Asian) | 100.0 /100 | #22 | Exceptional $53,874 |
| Immigrants | Eastern Asia | 100.0 /100 | #23 | Exceptional $53,806 |
| Immigrants | Denmark | 100.0 /100 | #24 | Exceptional $53,799 |
| Immigrants | Japan | 100.0 /100 | #25 | Exceptional $53,359 |
Demographics Similar to Immigrants from North America by Per Capita Income
In terms of per capita income, the demographic groups most similar to Immigrants from North America are Immigrants from Hungary ($49,303, a difference of 0.0%), Greek ($49,309, a difference of 0.010%), Immigrants from Eastern Europe ($49,316, a difference of 0.030%), Immigrants from Canada ($49,412, a difference of 0.22%), and Mongolian ($49,173, a difference of 0.26%).
| Demographics | Rating | Rank | Per Capita Income |
| Immigrants | Bulgaria | 99.9 /100 | #66 | Exceptional $49,482 |
| Immigrants | Romania | 99.9 /100 | #67 | Exceptional $49,463 |
| Lithuanians | 99.8 /100 | #68 | Exceptional $49,448 |
| Immigrants | Canada | 99.8 /100 | #69 | Exceptional $49,412 |
| Immigrants | Eastern Europe | 99.8 /100 | #70 | Exceptional $49,316 |
| Greeks | 99.8 /100 | #71 | Exceptional $49,309 |
| Immigrants | Hungary | 99.8 /100 | #72 | Exceptional $49,303 |
| Immigrants | North America | 99.8 /100 | #73 | Exceptional $49,302 |
| Mongolians | 99.8 /100 | #74 | Exceptional $49,173 |
| Immigrants | Bolivia | 99.7 /100 | #75 | Exceptional $48,970 |
| Immigrants | England | 99.7 /100 | #76 | Exceptional $48,844 |
| Immigrants | Kazakhstan | 99.7 /100 | #77 | Exceptional $48,747 |
| Immigrants | Italy | 99.6 /100 | #78 | Exceptional $48,654 |
| Romanians | 99.5 /100 | #79 | Exceptional $48,445 |
| Egyptians | 99.5 /100 | #80 | Exceptional $48,358 |