Thai vs Immigrants from Eastern Asia Householder Income Ages 45 - 64 years
COMPARE
Thai
Immigrants from Eastern Asia
Householder Income Ages 45 - 64 years
Householder Income Ages 45 - 64 years Comparison
Thais
Immigrants from Eastern Asia
$129,560
HOUSEHOLDER INCOME AGES 45 - 64 YEARS
100.0/ 100
METRIC RATING
4th/ 347
METRIC RANK
$122,222
HOUSEHOLDER INCOME AGES 45 - 64 YEARS
100.0/ 100
METRIC RATING
15th/ 347
METRIC RANK
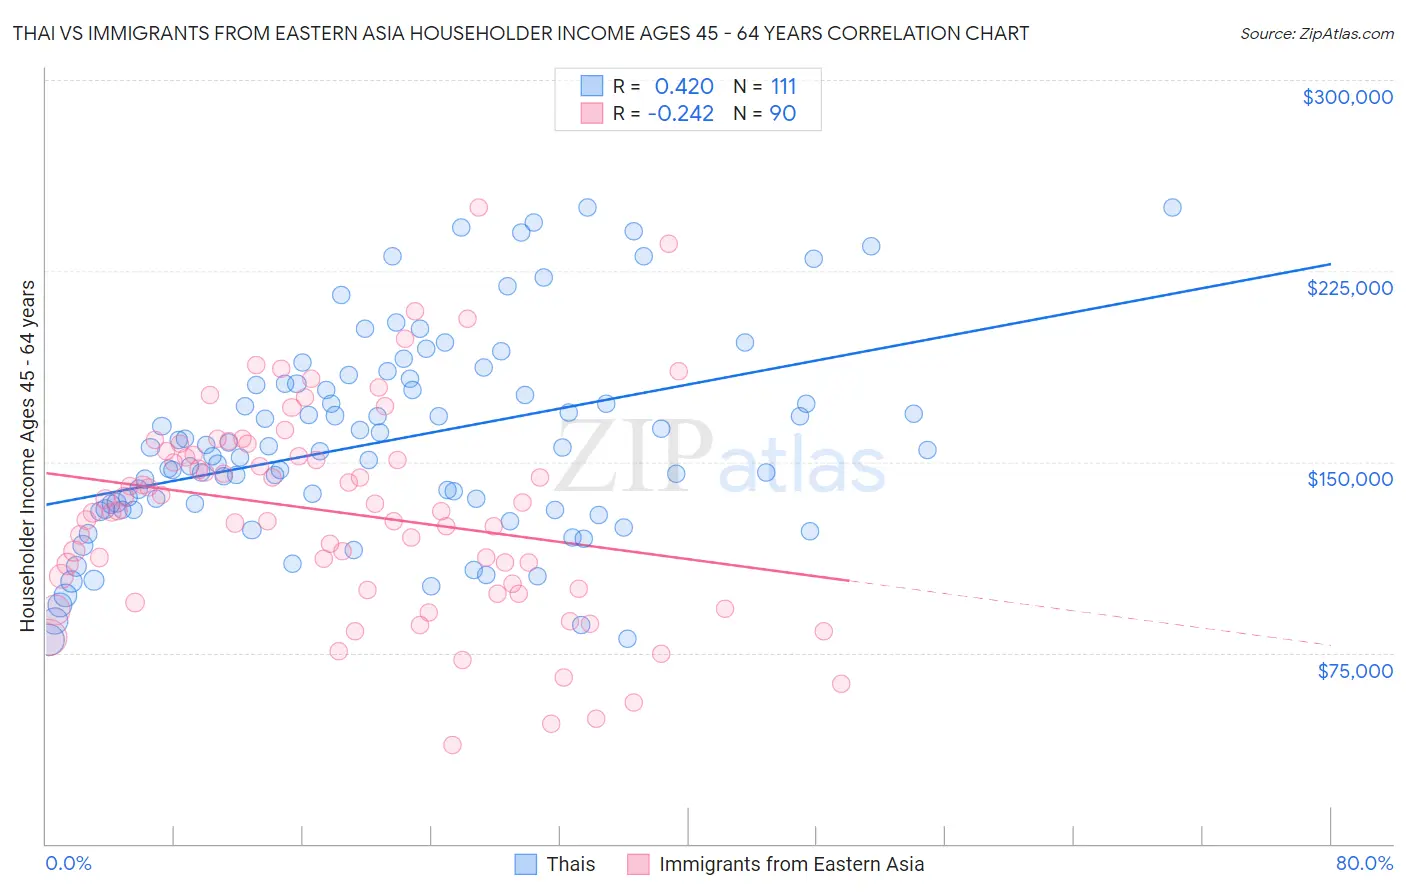
Thai vs Immigrants from Eastern Asia Householder Income Ages 45 - 64 years Correlation Chart
The statistical analysis conducted on geographies consisting of 474,584,420 people shows a moderate positive correlation between the proportion of Thais and household income with householder between the ages 45 and 64 in the United States with a correlation coefficient (R) of 0.420 and weighted average of $129,560. Similarly, the statistical analysis conducted on geographies consisting of 498,407,418 people shows a weak negative correlation between the proportion of Immigrants from Eastern Asia and household income with householder between the ages 45 and 64 in the United States with a correlation coefficient (R) of -0.242 and weighted average of $122,222, a difference of 6.0%.
Householder Income Ages 45 - 64 years Correlation Summary
| Measurement | Thai | Immigrants from Eastern Asia |
| Minimum | $80,277 | $38,713 |
| Maximum | $250,001 | $250,001 |
| Range | $169,724 | $211,288 |
| Mean | $158,060 | $130,069 |
| Median | $154,550 | $130,682 |
| Interquartile 25% (IQ1) | $131,303 | $99,983 |
| Interquartile 75% (IQ3) | $180,581 | $152,748 |
| Interquartile Range (IQR) | $49,278 | $52,765 |
| Standard Deviation (Sample) | $39,812 | $40,763 |
| Standard Deviation (Population) | $39,632 | $40,536 |
Demographics Similar to Thais and Immigrants from Eastern Asia by Householder Income Ages 45 - 64 years
In terms of householder income ages 45 - 64 years, the demographic groups most similar to Thais are Immigrants from Singapore ($129,514, a difference of 0.040%), Iranian ($129,350, a difference of 0.16%), Immigrants from Hong Kong ($127,500, a difference of 1.6%), Immigrants from Iran ($126,940, a difference of 2.1%), and Immigrants from India ($132,488, a difference of 2.3%). Similarly, the demographic groups most similar to Immigrants from Eastern Asia are Immigrants from China ($122,178, a difference of 0.040%), Indian (Asian) ($122,343, a difference of 0.10%), Immigrants from Ireland ($122,757, a difference of 0.44%), Immigrants from Israel ($122,893, a difference of 0.55%), and Burmese ($121,444, a difference of 0.64%).
| Demographics | Rating | Rank | Householder Income Ages 45 - 64 years |
| Immigrants | Taiwan | 100.0 /100 | #1 | Exceptional $135,508 |
| Filipinos | 100.0 /100 | #2 | Exceptional $134,910 |
| Immigrants | India | 100.0 /100 | #3 | Exceptional $132,488 |
| Thais | 100.0 /100 | #4 | Exceptional $129,560 |
| Immigrants | Singapore | 100.0 /100 | #5 | Exceptional $129,514 |
| Iranians | 100.0 /100 | #6 | Exceptional $129,350 |
| Immigrants | Hong Kong | 100.0 /100 | #7 | Exceptional $127,500 |
| Immigrants | Iran | 100.0 /100 | #8 | Exceptional $126,940 |
| Okinawans | 100.0 /100 | #9 | Exceptional $124,796 |
| Immigrants | South Central Asia | 100.0 /100 | #10 | Exceptional $124,188 |
| Cypriots | 100.0 /100 | #11 | Exceptional $123,396 |
| Immigrants | Israel | 100.0 /100 | #12 | Exceptional $122,893 |
| Immigrants | Ireland | 100.0 /100 | #13 | Exceptional $122,757 |
| Indians (Asian) | 100.0 /100 | #14 | Exceptional $122,343 |
| Immigrants | Eastern Asia | 100.0 /100 | #15 | Exceptional $122,222 |
| Immigrants | China | 100.0 /100 | #16 | Exceptional $122,178 |
| Burmese | 100.0 /100 | #17 | Exceptional $121,444 |
| Immigrants | Korea | 100.0 /100 | #18 | Exceptional $121,243 |
| Eastern Europeans | 100.0 /100 | #19 | Exceptional $120,684 |
| Immigrants | Australia | 100.0 /100 | #20 | Exceptional $119,308 |