Spaniard vs Tsimshian Householder Income Under 25 years
COMPARE
Spaniard
Tsimshian
Householder Income Under 25 years
Householder Income Under 25 years Comparison
Spaniards
Tsimshian
$51,117
HOUSEHOLDER INCOME UNDER 25 YEARS
6.8/ 100
METRIC RATING
222nd/ 347
METRIC RANK
$54,649
HOUSEHOLDER INCOME UNDER 25 YEARS
99.8/ 100
METRIC RATING
68th/ 347
METRIC RANK
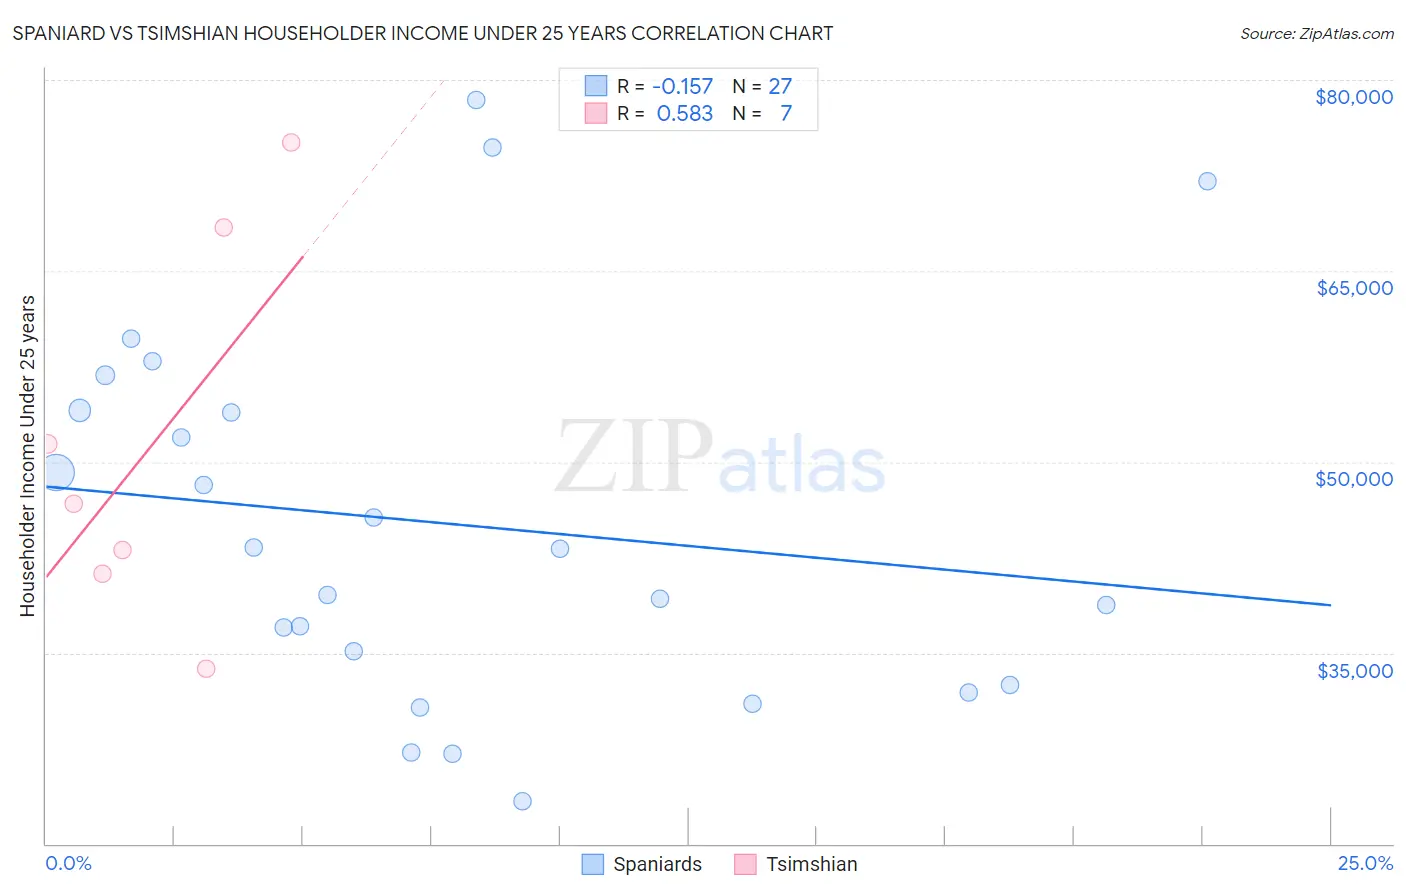
Spaniard vs Tsimshian Householder Income Under 25 years Correlation Chart
The statistical analysis conducted on geographies consisting of 367,865,283 people shows a poor negative correlation between the proportion of Spaniards and household income with householder under the age of 25 in the United States with a correlation coefficient (R) of -0.157 and weighted average of $51,117. Similarly, the statistical analysis conducted on geographies consisting of 15,054,955 people shows a substantial positive correlation between the proportion of Tsimshian and household income with householder under the age of 25 in the United States with a correlation coefficient (R) of 0.583 and weighted average of $54,649, a difference of 6.9%.
Householder Income Under 25 years Correlation Summary
| Measurement | Spaniard | Tsimshian |
| Minimum | $23,340 | $33,750 |
| Maximum | $78,408 | $75,104 |
| Range | $55,068 | $41,354 |
| Mean | $45,152 | $51,392 |
| Median | $43,152 | $46,717 |
| Interquartile 25% (IQ1) | $32,500 | $41,250 |
| Interquartile 75% (IQ3) | $54,035 | $68,393 |
| Interquartile Range (IQR) | $21,535 | $27,143 |
| Standard Deviation (Sample) | $14,752 | $15,031 |
| Standard Deviation (Population) | $14,476 | $13,916 |
Similar Demographics by Householder Income Under 25 years
Demographics Similar to Spaniards by Householder Income Under 25 years
In terms of householder income under 25 years, the demographic groups most similar to Spaniards are Serbian ($51,106, a difference of 0.020%), Belizean ($51,094, a difference of 0.050%), Immigrants from Eastern Africa ($51,158, a difference of 0.080%), Immigrants from Germany ($51,190, a difference of 0.14%), and Immigrants from Jamaica ($51,038, a difference of 0.16%).
| Demographics | Rating | Rank | Householder Income Under 25 years |
| Icelanders | 9.1 /100 | #215 | Tragic $51,247 |
| French | 8.7 /100 | #216 | Tragic $51,230 |
| Czechoslovakians | 8.6 /100 | #217 | Tragic $51,224 |
| Immigrants | Belize | 8.6 /100 | #218 | Tragic $51,223 |
| Arabs | 8.5 /100 | #219 | Tragic $51,219 |
| Immigrants | Germany | 8.0 /100 | #220 | Tragic $51,190 |
| Immigrants | Eastern Africa | 7.4 /100 | #221 | Tragic $51,158 |
| Spaniards | 6.8 /100 | #222 | Tragic $51,117 |
| Serbians | 6.6 /100 | #223 | Tragic $51,106 |
| Belizeans | 6.4 /100 | #224 | Tragic $51,094 |
| Immigrants | Jamaica | 5.6 /100 | #225 | Tragic $51,038 |
| Yugoslavians | 5.5 /100 | #226 | Tragic $51,028 |
| Immigrants | Central America | 5.4 /100 | #227 | Tragic $51,022 |
| Immigrants | Norway | 5.0 /100 | #228 | Tragic $50,984 |
| Yuman | 4.4 /100 | #229 | Tragic $50,933 |
Demographics Similar to Tsimshian by Householder Income Under 25 years
In terms of householder income under 25 years, the demographic groups most similar to Tsimshian are Samoan ($54,610, a difference of 0.070%), Immigrants from El Salvador ($54,599, a difference of 0.090%), Okinawan ($54,701, a difference of 0.10%), Immigrants from Morocco ($54,593, a difference of 0.10%), and Immigrants from Bangladesh ($54,714, a difference of 0.12%).
| Demographics | Rating | Rank | Householder Income Under 25 years |
| Immigrants | Europe | 99.9 /100 | #61 | Exceptional $55,022 |
| Immigrants | Uzbekistan | 99.8 /100 | #62 | Exceptional $54,846 |
| Immigrants | Belgium | 99.8 /100 | #63 | Exceptional $54,830 |
| Burmese | 99.8 /100 | #64 | Exceptional $54,800 |
| Yup'ik | 99.8 /100 | #65 | Exceptional $54,732 |
| Immigrants | Bangladesh | 99.8 /100 | #66 | Exceptional $54,714 |
| Okinawans | 99.8 /100 | #67 | Exceptional $54,701 |
| Tsimshian | 99.8 /100 | #68 | Exceptional $54,649 |
| Samoans | 99.7 /100 | #69 | Exceptional $54,610 |
| Immigrants | El Salvador | 99.7 /100 | #70 | Exceptional $54,599 |
| Immigrants | Morocco | 99.7 /100 | #71 | Exceptional $54,593 |
| Immigrants | Northern Europe | 99.7 /100 | #72 | Exceptional $54,571 |
| Macedonians | 99.7 /100 | #73 | Exceptional $54,563 |
| Immigrants | Grenada | 99.7 /100 | #74 | Exceptional $54,538 |
| Immigrants | Sri Lanka | 99.7 /100 | #75 | Exceptional $54,512 |