Serbian vs Czechoslovakian Householder Income Ages 45 - 64 years
COMPARE
Serbian
Czechoslovakian
Householder Income Ages 45 - 64 years
Householder Income Ages 45 - 64 years Comparison
Serbians
Czechoslovakians
$103,522
HOUSEHOLDER INCOME AGES 45 - 64 YEARS
83.2/ 100
METRIC RATING
143rd/ 347
METRIC RANK
$101,387
HOUSEHOLDER INCOME AGES 45 - 64 YEARS
63.0/ 100
METRIC RATING
167th/ 347
METRIC RANK
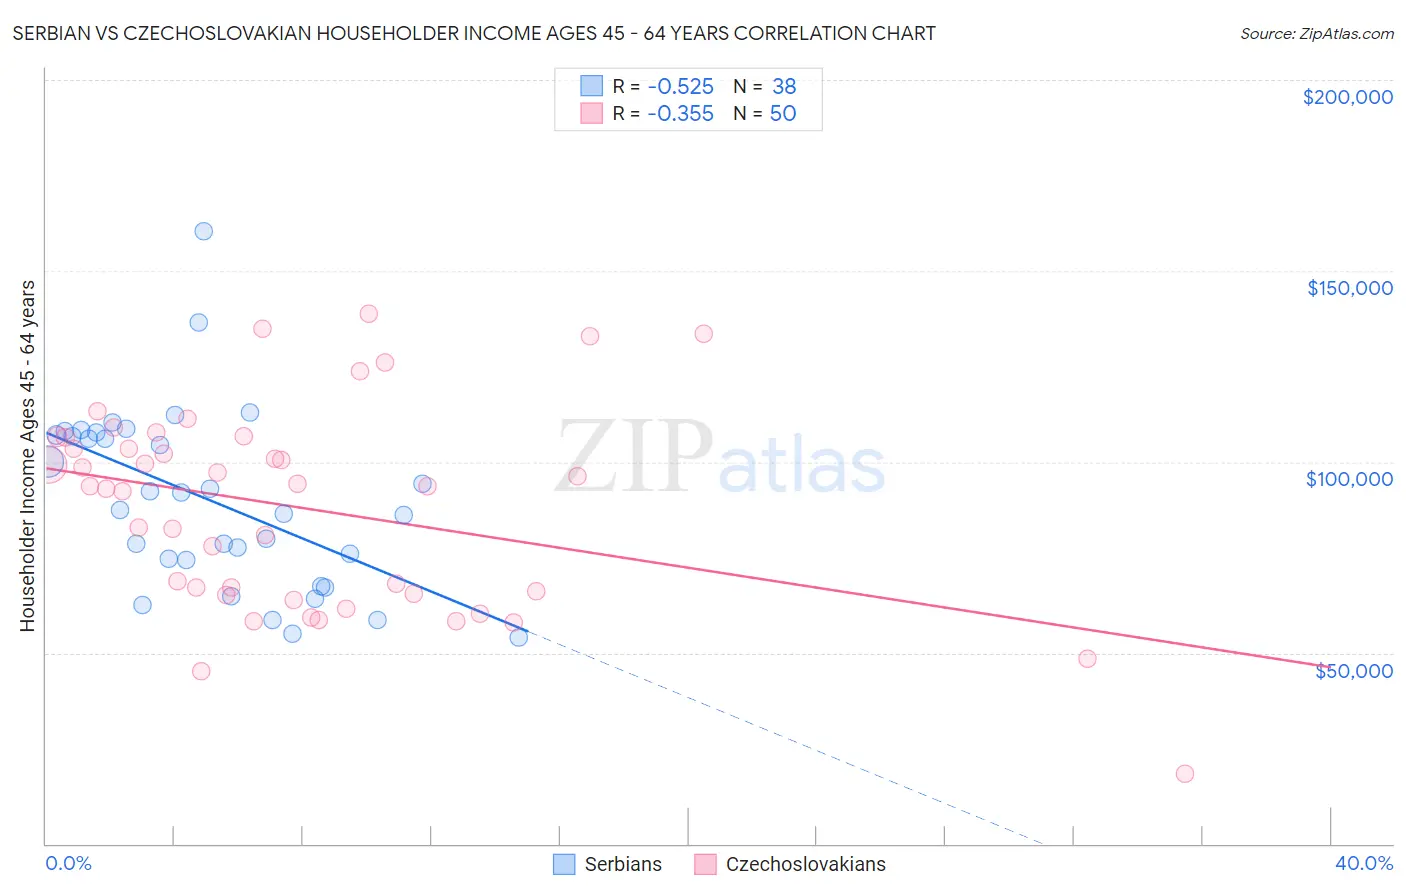
Serbian vs Czechoslovakian Householder Income Ages 45 - 64 years Correlation Chart
The statistical analysis conducted on geographies consisting of 267,315,581 people shows a substantial negative correlation between the proportion of Serbians and household income with householder between the ages 45 and 64 in the United States with a correlation coefficient (R) of -0.525 and weighted average of $103,522. Similarly, the statistical analysis conducted on geographies consisting of 368,168,264 people shows a mild negative correlation between the proportion of Czechoslovakians and household income with householder between the ages 45 and 64 in the United States with a correlation coefficient (R) of -0.355 and weighted average of $101,387, a difference of 2.1%.
Householder Income Ages 45 - 64 years Correlation Summary
| Measurement | Serbian | Czechoslovakian |
| Minimum | $53,958 | $18,333 |
| Maximum | $160,260 | $138,929 |
| Range | $106,302 | $120,596 |
| Mean | $89,963 | $87,984 |
| Median | $89,813 | $93,579 |
| Interquartile 25% (IQ1) | $74,285 | $65,365 |
| Interquartile 75% (IQ3) | $107,140 | $106,355 |
| Interquartile Range (IQR) | $32,855 | $40,989 |
| Standard Deviation (Sample) | $23,322 | $26,471 |
| Standard Deviation (Population) | $23,014 | $26,205 |
Similar Demographics by Householder Income Ages 45 - 64 years
Demographics Similar to Serbians by Householder Income Ages 45 - 64 years
In terms of householder income ages 45 - 64 years, the demographic groups most similar to Serbians are Luxembourger ($103,536, a difference of 0.010%), Czech ($103,507, a difference of 0.010%), Ugandan ($103,472, a difference of 0.050%), Immigrants from Uganda ($103,584, a difference of 0.060%), and Immigrants from Chile ($103,412, a difference of 0.11%).
| Demographics | Rating | Rank | Householder Income Ages 45 - 64 years |
| Taiwanese | 87.4 /100 | #136 | Excellent $104,180 |
| Hungarians | 85.8 /100 | #137 | Excellent $103,913 |
| Ethiopians | 84.7 /100 | #138 | Excellent $103,736 |
| Immigrants | Oceania | 84.5 /100 | #139 | Excellent $103,705 |
| Norwegians | 84.3 /100 | #140 | Excellent $103,682 |
| Immigrants | Uganda | 83.7 /100 | #141 | Excellent $103,584 |
| Luxembourgers | 83.3 /100 | #142 | Excellent $103,536 |
| Serbians | 83.2 /100 | #143 | Excellent $103,522 |
| Czechs | 83.1 /100 | #144 | Excellent $103,507 |
| Ugandans | 82.9 /100 | #145 | Excellent $103,472 |
| Immigrants | Chile | 82.5 /100 | #146 | Excellent $103,412 |
| Basques | 82.3 /100 | #147 | Excellent $103,387 |
| Immigrants | Germany | 81.5 /100 | #148 | Excellent $103,282 |
| Immigrants | Sierra Leone | 81.1 /100 | #149 | Excellent $103,227 |
| Immigrants | Peru | 80.7 /100 | #150 | Excellent $103,173 |
Demographics Similar to Czechoslovakians by Householder Income Ages 45 - 64 years
In terms of householder income ages 45 - 64 years, the demographic groups most similar to Czechoslovakians are Samoan ($101,580, a difference of 0.19%), South American Indian ($101,171, a difference of 0.21%), Guamanian/Chamorro ($101,170, a difference of 0.21%), Slovak ($101,029, a difference of 0.35%), and South American ($100,837, a difference of 0.54%).
| Demographics | Rating | Rank | Householder Income Ages 45 - 64 years |
| Icelanders | 72.5 /100 | #160 | Good $102,261 |
| Immigrants | Nepal | 71.8 /100 | #161 | Good $102,190 |
| Scottish | 71.1 /100 | #162 | Good $102,123 |
| English | 70.1 /100 | #163 | Good $102,021 |
| Immigrants | Morocco | 70.0 /100 | #164 | Good $102,015 |
| Immigrants | Albania | 69.4 /100 | #165 | Good $101,957 |
| Samoans | 65.3 /100 | #166 | Good $101,580 |
| Czechoslovakians | 63.0 /100 | #167 | Good $101,387 |
| South American Indians | 60.5 /100 | #168 | Good $101,171 |
| Guamanians/Chamorros | 60.5 /100 | #169 | Good $101,170 |
| Slovaks | 58.8 /100 | #170 | Average $101,029 |
| South Americans | 56.4 /100 | #171 | Average $100,837 |
| Immigrants | Uzbekistan | 52.5 /100 | #172 | Average $100,523 |
| Alsatians | 51.4 /100 | #173 | Average $100,435 |
| Welsh | 50.0 /100 | #174 | Average $100,322 |