Paiute vs Bahamian Median Family Income
COMPARE
Paiute
Bahamian
Median Family Income
Median Family Income Comparison
Paiute
Bahamians
$85,414
MEDIAN FAMILY INCOME
0.0/ 100
METRIC RATING
305th/ 347
METRIC RANK
$82,631
MEDIAN FAMILY INCOME
0.0/ 100
METRIC RATING
323rd/ 347
METRIC RANK
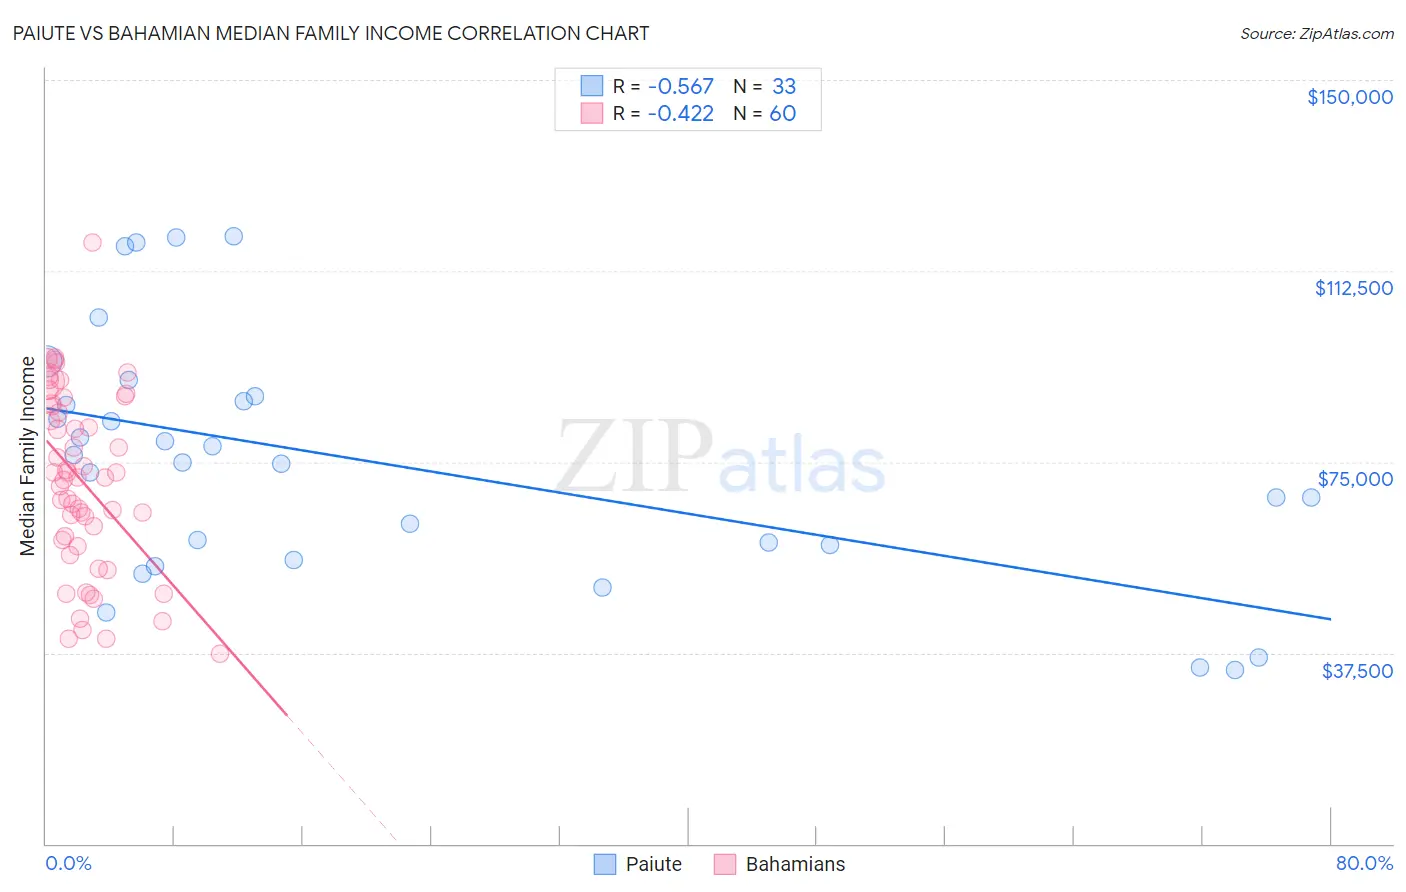
Paiute vs Bahamian Median Family Income Correlation Chart
The statistical analysis conducted on geographies consisting of 58,388,516 people shows a substantial negative correlation between the proportion of Paiute and median family income in the United States with a correlation coefficient (R) of -0.567 and weighted average of $85,414. Similarly, the statistical analysis conducted on geographies consisting of 112,596,489 people shows a moderate negative correlation between the proportion of Bahamians and median family income in the United States with a correlation coefficient (R) of -0.422 and weighted average of $82,631, a difference of 3.4%.
Median Family Income Correlation Summary
| Measurement | Paiute | Bahamian |
| Minimum | $34,107 | $37,231 |
| Maximum | $119,375 | $118,067 |
| Range | $85,268 | $80,836 |
| Mean | $74,748 | $71,118 |
| Median | $74,830 | $71,812 |
| Interquartile 25% (IQ1) | $57,230 | $59,044 |
| Interquartile 75% (IQ3) | $87,390 | $86,176 |
| Interquartile Range (IQR) | $30,160 | $27,132 |
| Standard Deviation (Sample) | $23,830 | $17,647 |
| Standard Deviation (Population) | $23,466 | $17,499 |
Demographics Similar to Paiute and Bahamians by Median Family Income
In terms of median family income, the demographic groups most similar to Paiute are Immigrants from Dominica ($85,411, a difference of 0.0%), Chickasaw ($85,356, a difference of 0.070%), U.S. Virgin Islander ($85,294, a difference of 0.14%), Haitian ($85,218, a difference of 0.23%), and Mexican ($85,618, a difference of 0.24%). Similarly, the demographic groups most similar to Bahamians are Creek ($82,560, a difference of 0.090%), Dominican ($82,888, a difference of 0.31%), Immigrants from Caribbean ($83,319, a difference of 0.83%), Seminole ($83,354, a difference of 0.87%), and Immigrants from Honduras ($83,618, a difference of 1.2%).
| Demographics | Rating | Rank | Median Family Income |
| Mexicans | 0.0 /100 | #304 | Tragic $85,618 |
| Paiute | 0.0 /100 | #305 | Tragic $85,414 |
| Immigrants | Dominica | 0.0 /100 | #306 | Tragic $85,411 |
| Chickasaw | 0.0 /100 | #307 | Tragic $85,356 |
| U.S. Virgin Islanders | 0.0 /100 | #308 | Tragic $85,294 |
| Haitians | 0.0 /100 | #309 | Tragic $85,218 |
| Immigrants | Central America | 0.0 /100 | #310 | Tragic $85,050 |
| Hondurans | 0.0 /100 | #311 | Tragic $85,004 |
| Cubans | 0.0 /100 | #312 | Tragic $84,981 |
| Choctaw | 0.0 /100 | #313 | Tragic $84,835 |
| Immigrants | Bahamas | 0.0 /100 | #314 | Tragic $84,732 |
| Apache | 0.0 /100 | #315 | Tragic $84,451 |
| Immigrants | Haiti | 0.0 /100 | #316 | Tragic $84,018 |
| Yakama | 0.0 /100 | #317 | Tragic $83,932 |
| Immigrants | Mexico | 0.0 /100 | #318 | Tragic $83,639 |
| Immigrants | Honduras | 0.0 /100 | #319 | Tragic $83,618 |
| Seminole | 0.0 /100 | #320 | Tragic $83,354 |
| Immigrants | Caribbean | 0.0 /100 | #321 | Tragic $83,319 |
| Dominicans | 0.0 /100 | #322 | Tragic $82,888 |
| Bahamians | 0.0 /100 | #323 | Tragic $82,631 |
| Creek | 0.0 /100 | #324 | Tragic $82,560 |