Northern European vs Croatian Median Family Income
COMPARE
Northern European
Croatian
Median Family Income
Median Family Income Comparison
Northern Europeans
Croatians
$110,635
MEDIAN FAMILY INCOME
98.3/ 100
METRIC RATING
90th/ 347
METRIC RANK
$111,370
MEDIAN FAMILY INCOME
98.8/ 100
METRIC RATING
85th/ 347
METRIC RANK
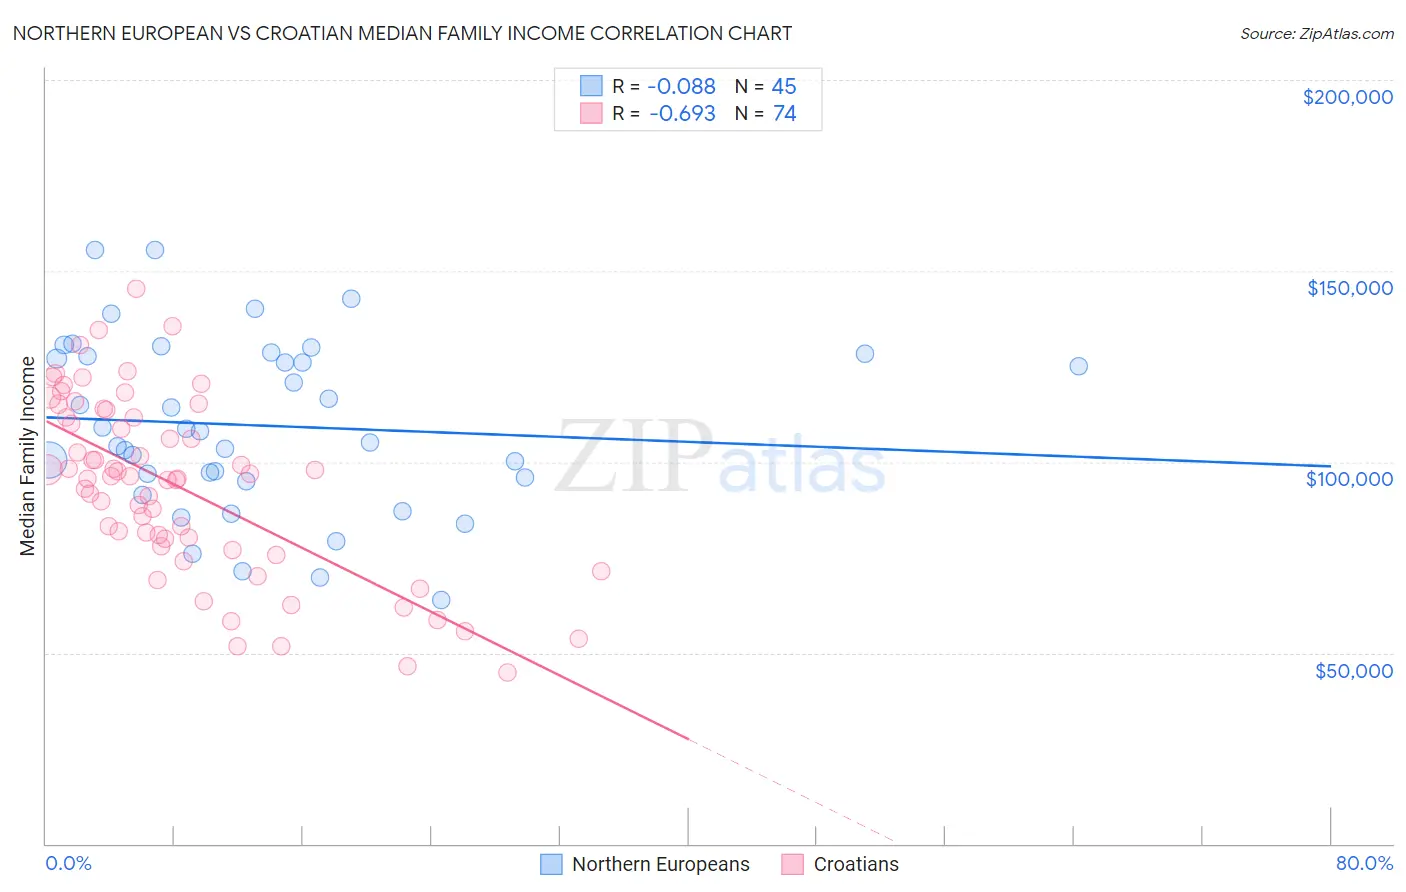
Northern European vs Croatian Median Family Income Correlation Chart
The statistical analysis conducted on geographies consisting of 405,831,688 people shows a slight negative correlation between the proportion of Northern Europeans and median family income in the United States with a correlation coefficient (R) of -0.088 and weighted average of $110,635. Similarly, the statistical analysis conducted on geographies consisting of 375,427,421 people shows a significant negative correlation between the proportion of Croatians and median family income in the United States with a correlation coefficient (R) of -0.693 and weighted average of $111,370, a difference of 0.66%.
Median Family Income Correlation Summary
| Measurement | Northern European | Croatian |
| Minimum | $63,831 | $44,806 |
| Maximum | $155,510 | $145,180 |
| Range | $91,679 | $100,374 |
| Mean | $109,529 | $93,423 |
| Median | $108,010 | $95,958 |
| Interquartile 25% (IQ1) | $95,374 | $78,056 |
| Interquartile 75% (IQ3) | $127,951 | $111,742 |
| Interquartile Range (IQR) | $32,577 | $33,686 |
| Standard Deviation (Sample) | $22,485 | $23,244 |
| Standard Deviation (Population) | $22,234 | $23,087 |
Demographics Similar to Northern Europeans and Croatians by Median Family Income
In terms of median family income, the demographic groups most similar to Northern Europeans are Immigrants from Southern Europe ($110,614, a difference of 0.020%), Immigrants from Argentina ($110,873, a difference of 0.21%), Immigrants from Lebanon ($110,159, a difference of 0.43%), Immigrants from Kazakhstan ($110,137, a difference of 0.45%), and Korean ($110,103, a difference of 0.48%). Similarly, the demographic groups most similar to Croatians are Ukrainian ($111,368, a difference of 0.0%), Immigrants from Hungary ($111,378, a difference of 0.010%), Austrian ($111,306, a difference of 0.060%), Romanian ($111,243, a difference of 0.11%), and Immigrants from Egypt ($111,689, a difference of 0.29%).
| Demographics | Rating | Rank | Median Family Income |
| Immigrants | Eastern Europe | 99.4 /100 | #77 | Exceptional $112,527 |
| Immigrants | Canada | 99.3 /100 | #78 | Exceptional $112,374 |
| Italians | 99.3 /100 | #79 | Exceptional $112,372 |
| Immigrants | Croatia | 99.3 /100 | #80 | Exceptional $112,323 |
| Immigrants | North America | 99.2 /100 | #81 | Exceptional $112,151 |
| Immigrants | England | 99.2 /100 | #82 | Exceptional $112,038 |
| Immigrants | Egypt | 99.0 /100 | #83 | Exceptional $111,689 |
| Immigrants | Hungary | 98.8 /100 | #84 | Exceptional $111,378 |
| Croatians | 98.8 /100 | #85 | Exceptional $111,370 |
| Ukrainians | 98.8 /100 | #86 | Exceptional $111,368 |
| Austrians | 98.8 /100 | #87 | Exceptional $111,306 |
| Romanians | 98.8 /100 | #88 | Exceptional $111,243 |
| Immigrants | Argentina | 98.5 /100 | #89 | Exceptional $110,873 |
| Northern Europeans | 98.3 /100 | #90 | Exceptional $110,635 |
| Immigrants | Southern Europe | 98.3 /100 | #91 | Exceptional $110,614 |
| Immigrants | Lebanon | 97.9 /100 | #92 | Exceptional $110,159 |
| Immigrants | Kazakhstan | 97.8 /100 | #93 | Exceptional $110,137 |
| Koreans | 97.8 /100 | #94 | Exceptional $110,103 |
| Zimbabweans | 97.7 /100 | #95 | Exceptional $110,011 |
| Immigrants | Moldova | 97.7 /100 | #96 | Exceptional $109,975 |
| Jordanians | 97.5 /100 | #97 | Exceptional $109,865 |