Native/Alaskan vs Lumbee Householder Income Ages 45 - 64 years
COMPARE
Native/Alaskan
Lumbee
Householder Income Ages 45 - 64 years
Householder Income Ages 45 - 64 years Comparison
Natives/Alaskans
Lumbee
$79,816
HOUSEHOLDER INCOME AGES 45 - 64 YEARS
0.0/ 100
METRIC RATING
328th/ 347
METRIC RANK
$65,113
HOUSEHOLDER INCOME AGES 45 - 64 YEARS
0.0/ 100
METRIC RATING
347th/ 347
METRIC RANK
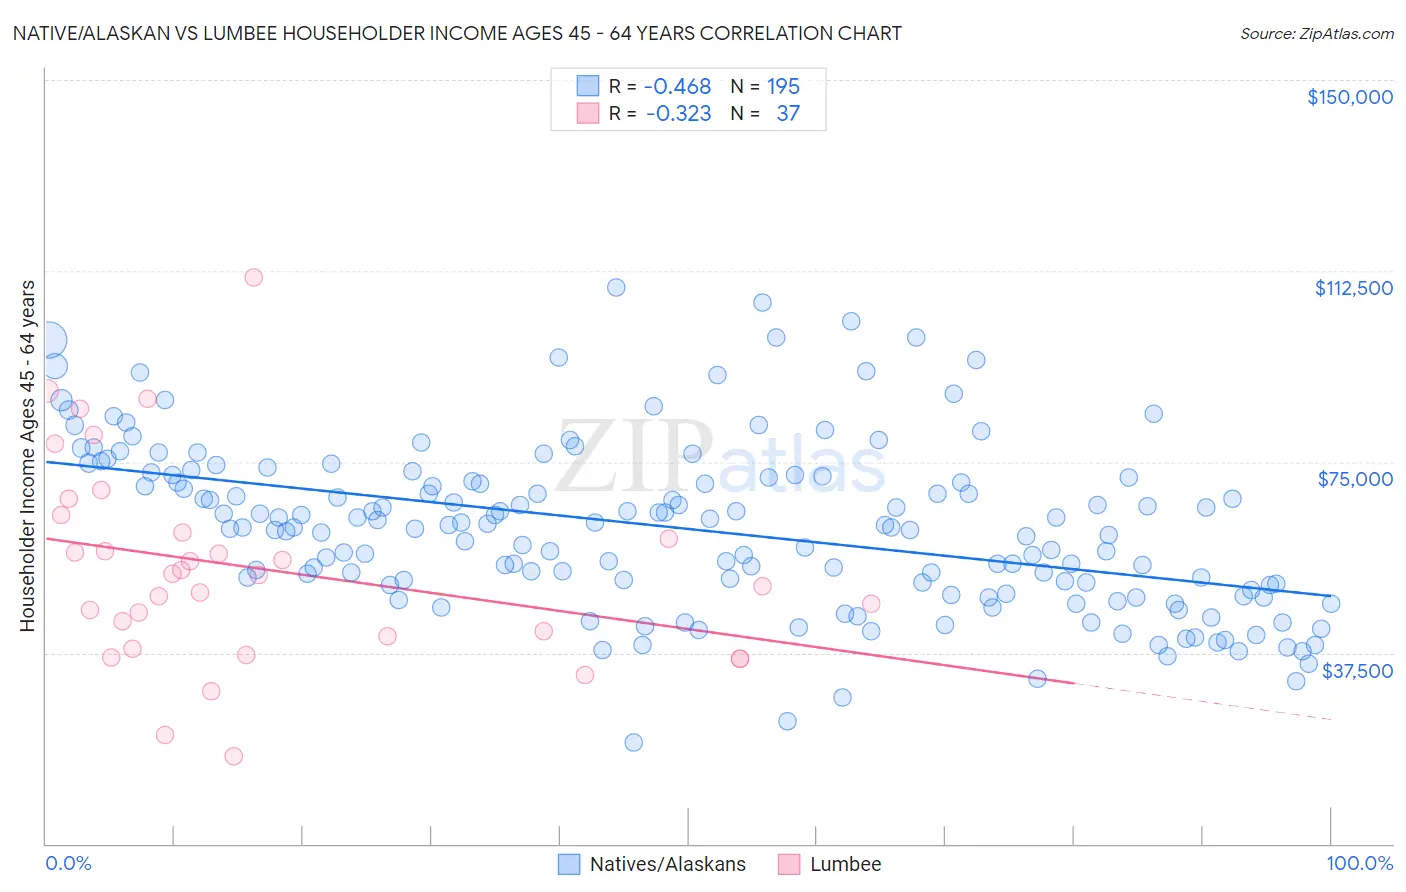
Native/Alaskan vs Lumbee Householder Income Ages 45 - 64 years Correlation Chart
The statistical analysis conducted on geographies consisting of 510,837,731 people shows a moderate negative correlation between the proportion of Natives/Alaskans and household income with householder between the ages 45 and 64 in the United States with a correlation coefficient (R) of -0.468 and weighted average of $79,816. Similarly, the statistical analysis conducted on geographies consisting of 92,190,651 people shows a mild negative correlation between the proportion of Lumbee and household income with householder between the ages 45 and 64 in the United States with a correlation coefficient (R) of -0.323 and weighted average of $65,113, a difference of 22.6%.
Householder Income Ages 45 - 64 years Correlation Summary
| Measurement | Native/Alaskan | Lumbee |
| Minimum | $19,886 | $17,237 |
| Maximum | $109,193 | $111,146 |
| Range | $89,307 | $93,909 |
| Mean | $61,887 | $53,963 |
| Median | $62,067 | $52,786 |
| Interquartile 25% (IQ1) | $50,757 | $39,477 |
| Interquartile 75% (IQ3) | $72,020 | $62,870 |
| Interquartile Range (IQR) | $21,263 | $23,393 |
| Standard Deviation (Sample) | $16,443 | $19,805 |
| Standard Deviation (Population) | $16,401 | $19,536 |
Demographics Similar to Natives/Alaskans and Lumbee by Householder Income Ages 45 - 64 years
In terms of householder income ages 45 - 64 years, the demographic groups most similar to Natives/Alaskans are Seminole ($80,077, a difference of 0.33%), Dutch West Indian ($79,171, a difference of 0.82%), Creek ($78,960, a difference of 1.1%), Immigrants from Dominican Republic ($78,836, a difference of 1.2%), and Black/African American ($78,556, a difference of 1.6%). Similarly, the demographic groups most similar to Lumbee are Puerto Rican ($69,234, a difference of 6.3%), Navajo ($69,759, a difference of 7.1%), Houma ($72,093, a difference of 10.7%), Pima ($73,365, a difference of 12.7%), and Tohono O'odham ($73,774, a difference of 13.3%).
| Demographics | Rating | Rank | Householder Income Ages 45 - 64 years |
| Seminole | 0.0 /100 | #327 | Tragic $80,077 |
| Natives/Alaskans | 0.0 /100 | #328 | Tragic $79,816 |
| Dutch West Indians | 0.0 /100 | #329 | Tragic $79,171 |
| Creek | 0.0 /100 | #330 | Tragic $78,960 |
| Immigrants | Dominican Republic | 0.0 /100 | #331 | Tragic $78,836 |
| Blacks/African Americans | 0.0 /100 | #332 | Tragic $78,556 |
| Immigrants | Congo | 0.0 /100 | #333 | Tragic $77,850 |
| Menominee | 0.0 /100 | #334 | Tragic $76,903 |
| Cheyenne | 0.0 /100 | #335 | Tragic $76,362 |
| Arapaho | 0.0 /100 | #336 | Tragic $75,945 |
| Pueblo | 0.0 /100 | #337 | Tragic $75,601 |
| Hopi | 0.0 /100 | #338 | Tragic $75,562 |
| Kiowa | 0.0 /100 | #339 | Tragic $74,815 |
| Immigrants | Yemen | 0.0 /100 | #340 | Tragic $74,575 |
| Crow | 0.0 /100 | #341 | Tragic $74,257 |
| Tohono O'odham | 0.0 /100 | #342 | Tragic $73,774 |
| Pima | 0.0 /100 | #343 | Tragic $73,365 |
| Houma | 0.0 /100 | #344 | Tragic $72,093 |
| Navajo | 0.0 /100 | #345 | Tragic $69,759 |
| Puerto Ricans | 0.0 /100 | #346 | Tragic $69,234 |
| Lumbee | 0.0 /100 | #347 | Tragic $65,113 |