Macedonian vs Marshallese Householder Income Ages 45 - 64 years
COMPARE
Macedonian
Marshallese
Householder Income Ages 45 - 64 years
Householder Income Ages 45 - 64 years Comparison
Macedonians
Marshallese
$107,074
HOUSEHOLDER INCOME AGES 45 - 64 YEARS
96.7/ 100
METRIC RATING
105th/ 347
METRIC RANK
$90,455
HOUSEHOLDER INCOME AGES 45 - 64 YEARS
0.7/ 100
METRIC RATING
252nd/ 347
METRIC RANK
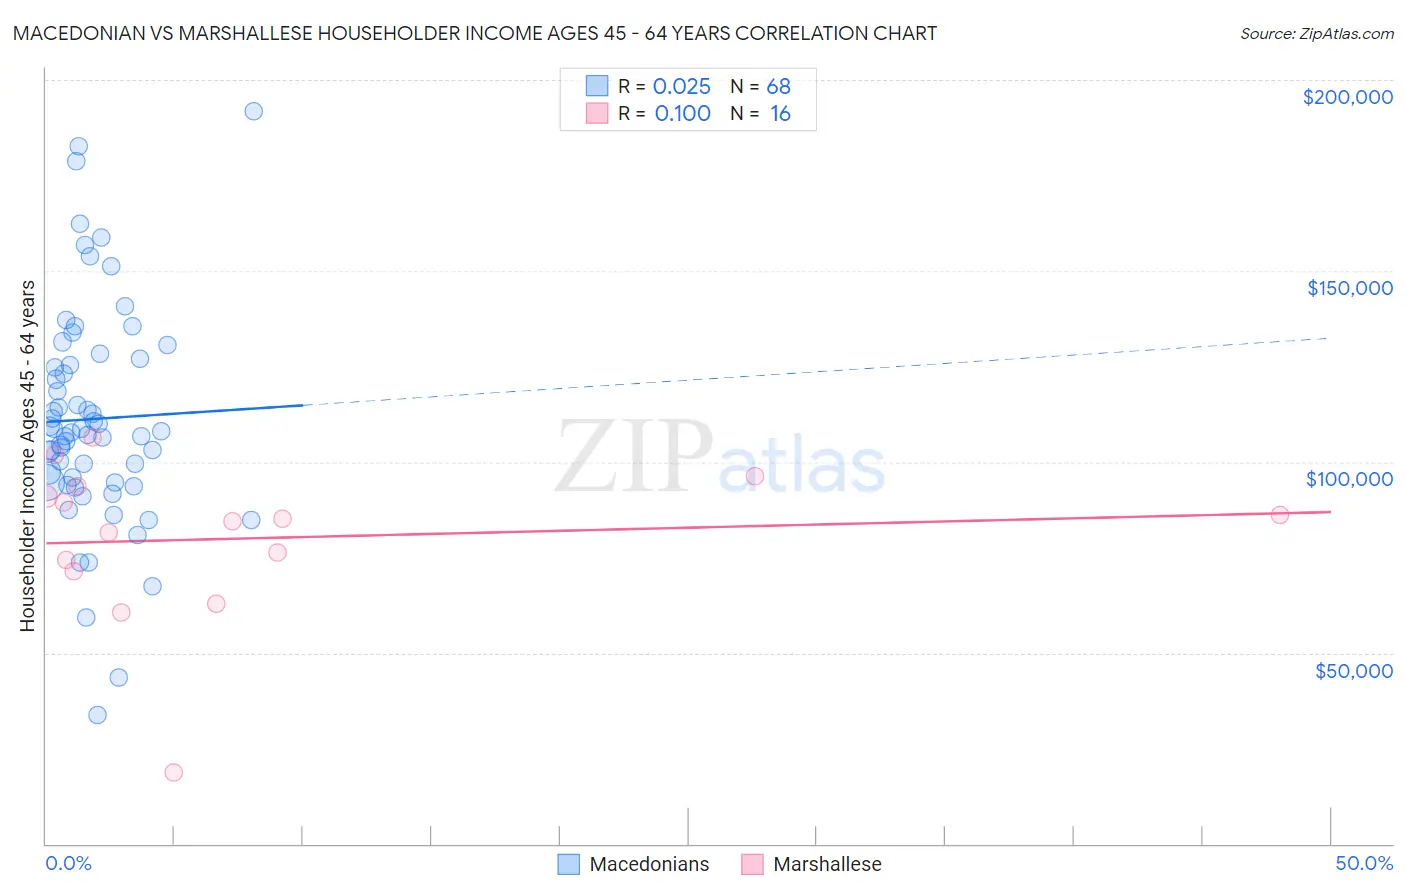
Macedonian vs Marshallese Householder Income Ages 45 - 64 years Correlation Chart
The statistical analysis conducted on geographies consisting of 132,534,739 people shows no correlation between the proportion of Macedonians and household income with householder between the ages 45 and 64 in the United States with a correlation coefficient (R) of 0.025 and weighted average of $107,074. Similarly, the statistical analysis conducted on geographies consisting of 14,751,694 people shows a slight positive correlation between the proportion of Marshallese and household income with householder between the ages 45 and 64 in the United States with a correlation coefficient (R) of 0.100 and weighted average of $90,455, a difference of 18.4%.
Householder Income Ages 45 - 64 years Correlation Summary
| Measurement | Macedonian | Marshallese |
| Minimum | $33,654 | $18,640 |
| Maximum | $191,897 | $106,252 |
| Range | $158,243 | $87,612 |
| Mean | $111,238 | $79,964 |
| Median | $107,950 | $84,819 |
| Interquartile 25% (IQ1) | $94,511 | $72,758 |
| Interquartile 75% (IQ3) | $126,299 | $92,231 |
| Interquartile Range (IQR) | $31,788 | $19,473 |
| Standard Deviation (Sample) | $29,150 | $20,771 |
| Standard Deviation (Population) | $28,934 | $20,112 |
Similar Demographics by Householder Income Ages 45 - 64 years
Demographics Similar to Macedonians by Householder Income Ages 45 - 64 years
In terms of householder income ages 45 - 64 years, the demographic groups most similar to Macedonians are Immigrants from Ukraine ($107,079, a difference of 0.0%), Armenian ($107,002, a difference of 0.070%), Immigrants from Fiji ($106,952, a difference of 0.11%), Syrian ($107,207, a difference of 0.12%), and Zimbabwean ($106,849, a difference of 0.21%).
| Demographics | Rating | Rank | Householder Income Ages 45 - 64 years |
| Immigrants | Southern Europe | 97.7 /100 | #98 | Exceptional $107,775 |
| Palestinians | 97.6 /100 | #99 | Exceptional $107,721 |
| Immigrants | Serbia | 97.4 /100 | #100 | Exceptional $107,569 |
| Immigrants | Kazakhstan | 97.2 /100 | #101 | Exceptional $107,378 |
| Immigrants | Moldova | 97.1 /100 | #102 | Exceptional $107,357 |
| Syrians | 96.9 /100 | #103 | Exceptional $107,207 |
| Immigrants | Ukraine | 96.7 /100 | #104 | Exceptional $107,079 |
| Macedonians | 96.7 /100 | #105 | Exceptional $107,074 |
| Armenians | 96.6 /100 | #106 | Exceptional $107,002 |
| Immigrants | Fiji | 96.5 /100 | #107 | Exceptional $106,952 |
| Zimbabweans | 96.3 /100 | #108 | Exceptional $106,849 |
| Chileans | 95.9 /100 | #109 | Exceptional $106,611 |
| Immigrants | Brazil | 95.6 /100 | #110 | Exceptional $106,470 |
| Immigrants | Vietnam | 95.5 /100 | #111 | Exceptional $106,417 |
| Swedes | 95.4 /100 | #112 | Exceptional $106,377 |
Demographics Similar to Marshallese by Householder Income Ages 45 - 64 years
In terms of householder income ages 45 - 64 years, the demographic groups most similar to Marshallese are American ($90,536, a difference of 0.090%), Barbadian ($90,266, a difference of 0.21%), Subsaharan African ($90,691, a difference of 0.26%), Immigrants from Guyana ($90,186, a difference of 0.30%), and Mexican American Indian ($90,811, a difference of 0.39%).
| Demographics | Rating | Rank | Householder Income Ages 45 - 64 years |
| Guyanese | 0.9 /100 | #245 | Tragic $90,966 |
| Central Americans | 0.9 /100 | #246 | Tragic $90,951 |
| Alaskan Athabascans | 0.9 /100 | #247 | Tragic $90,951 |
| Immigrants | Laos | 0.9 /100 | #248 | Tragic $90,909 |
| Mexican American Indians | 0.8 /100 | #249 | Tragic $90,811 |
| Sub-Saharan Africans | 0.8 /100 | #250 | Tragic $90,691 |
| Americans | 0.7 /100 | #251 | Tragic $90,536 |
| Marshallese | 0.7 /100 | #252 | Tragic $90,455 |
| Barbadians | 0.6 /100 | #253 | Tragic $90,266 |
| Immigrants | Guyana | 0.6 /100 | #254 | Tragic $90,186 |
| West Indians | 0.5 /100 | #255 | Tragic $89,906 |
| French American Indians | 0.5 /100 | #256 | Tragic $89,811 |
| German Russians | 0.4 /100 | #257 | Tragic $89,398 |
| Immigrants | Barbados | 0.4 /100 | #258 | Tragic $89,394 |
| Immigrants | Nicaragua | 0.4 /100 | #259 | Tragic $89,108 |