Irish vs Immigrants from South Eastern Asia Householder Income Ages 45 - 64 years
COMPARE
Irish
Immigrants from South Eastern Asia
Householder Income Ages 45 - 64 years
Householder Income Ages 45 - 64 years Comparison
Irish
Immigrants from South Eastern Asia
$103,067
HOUSEHOLDER INCOME AGES 45 - 64 YEARS
79.8/ 100
METRIC RATING
152nd/ 347
METRIC RANK
$106,109
HOUSEHOLDER INCOME AGES 45 - 64 YEARS
94.8/ 100
METRIC RATING
120th/ 347
METRIC RANK
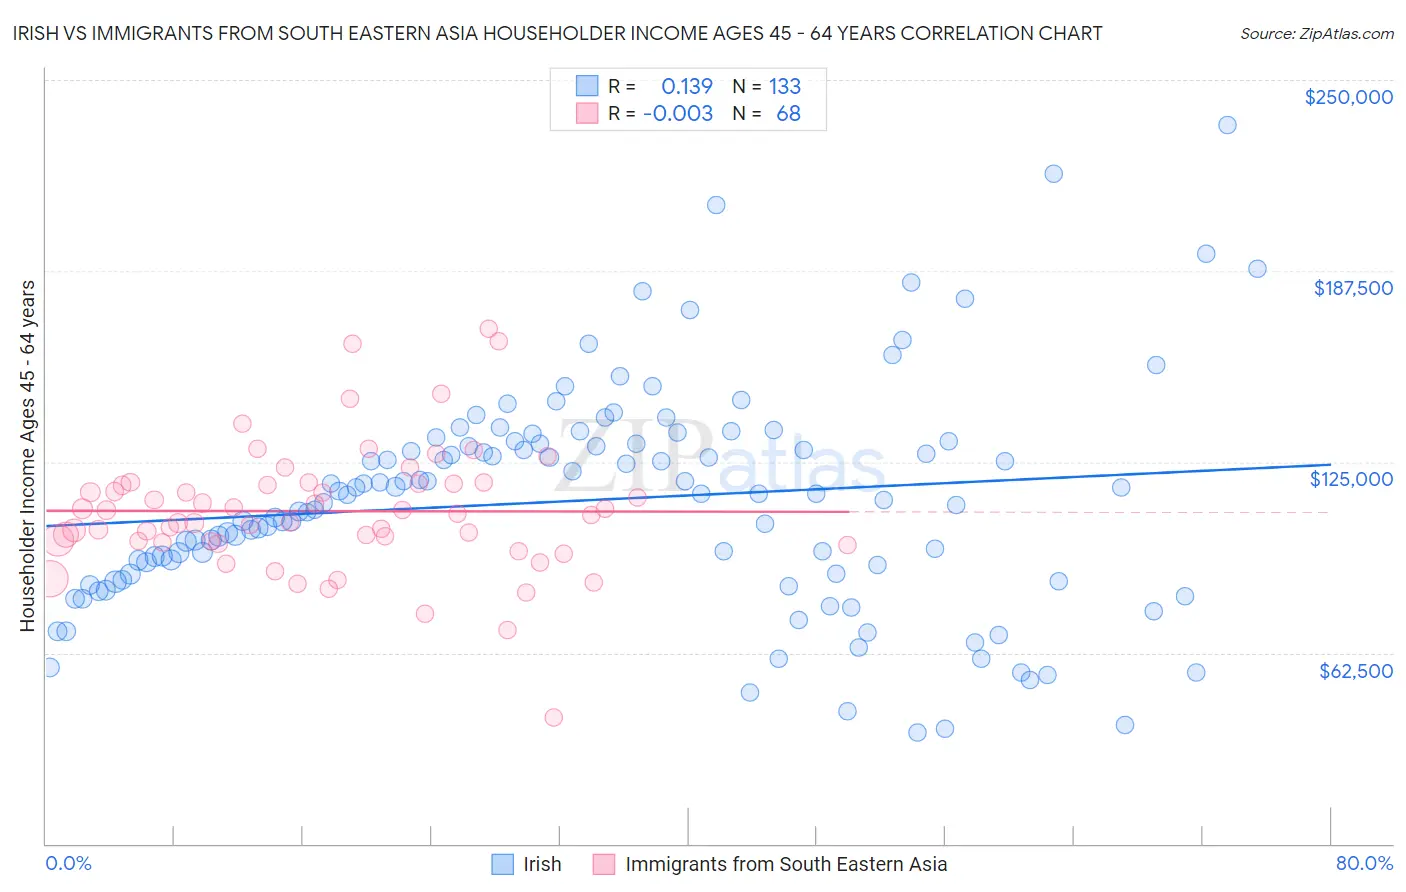
Irish vs Immigrants from South Eastern Asia Householder Income Ages 45 - 64 years Correlation Chart
The statistical analysis conducted on geographies consisting of 575,418,990 people shows a poor positive correlation between the proportion of Irish and household income with householder between the ages 45 and 64 in the United States with a correlation coefficient (R) of 0.139 and weighted average of $103,067. Similarly, the statistical analysis conducted on geographies consisting of 511,033,304 people shows no correlation between the proportion of Immigrants from South Eastern Asia and household income with householder between the ages 45 and 64 in the United States with a correlation coefficient (R) of -0.003 and weighted average of $106,109, a difference of 2.9%.
Householder Income Ages 45 - 64 years Correlation Summary
| Measurement | Irish | Immigrants from South Eastern Asia |
| Minimum | $36,603 | $41,250 |
| Maximum | $235,114 | $168,774 |
| Range | $198,511 | $127,524 |
| Mean | $112,465 | $108,858 |
| Median | $114,544 | $107,753 |
| Interquartile 25% (IQ1) | $88,235 | $98,855 |
| Interquartile 75% (IQ3) | $131,325 | $117,791 |
| Interquartile Range (IQR) | $43,090 | $18,936 |
| Standard Deviation (Sample) | $36,410 | $20,977 |
| Standard Deviation (Population) | $36,273 | $20,822 |
Similar Demographics by Householder Income Ages 45 - 64 years
Demographics Similar to Irish by Householder Income Ages 45 - 64 years
In terms of householder income ages 45 - 64 years, the demographic groups most similar to Irish are Swiss ($103,071, a difference of 0.0%), Scandinavian ($102,969, a difference of 0.090%), Immigrants from Peru ($103,173, a difference of 0.10%), Immigrants from Sierra Leone ($103,227, a difference of 0.16%), and Slovene ($102,885, a difference of 0.18%).
| Demographics | Rating | Rank | Householder Income Ages 45 - 64 years |
| Ugandans | 82.9 /100 | #145 | Excellent $103,472 |
| Immigrants | Chile | 82.5 /100 | #146 | Excellent $103,412 |
| Basques | 82.3 /100 | #147 | Excellent $103,387 |
| Immigrants | Germany | 81.5 /100 | #148 | Excellent $103,282 |
| Immigrants | Sierra Leone | 81.1 /100 | #149 | Excellent $103,227 |
| Immigrants | Peru | 80.7 /100 | #150 | Excellent $103,173 |
| Swiss | 79.9 /100 | #151 | Good $103,071 |
| Irish | 79.8 /100 | #152 | Good $103,067 |
| Scandinavians | 79.0 /100 | #153 | Good $102,969 |
| Slovenes | 78.3 /100 | #154 | Good $102,885 |
| Costa Ricans | 77.4 /100 | #155 | Good $102,779 |
| Carpatho Rusyns | 77.4 /100 | #156 | Good $102,777 |
| Immigrants | Ethiopia | 77.3 /100 | #157 | Good $102,763 |
| Slavs | 76.1 /100 | #158 | Good $102,629 |
| Sierra Leoneans | 74.2 /100 | #159 | Good $102,427 |
Demographics Similar to Immigrants from South Eastern Asia by Householder Income Ages 45 - 64 years
In terms of householder income ages 45 - 64 years, the demographic groups most similar to Immigrants from South Eastern Asia are Immigrants from Jordan ($106,164, a difference of 0.050%), Immigrants from Western Asia ($106,217, a difference of 0.10%), Albanian ($106,243, a difference of 0.13%), British ($106,264, a difference of 0.15%), and Polish ($105,952, a difference of 0.15%).
| Demographics | Rating | Rank | Householder Income Ages 45 - 64 years |
| Europeans | 95.4 /100 | #113 | Exceptional $106,367 |
| Immigrants | Poland | 95.3 /100 | #114 | Exceptional $106,319 |
| Immigrants | Kuwait | 95.2 /100 | #115 | Exceptional $106,285 |
| British | 95.2 /100 | #116 | Exceptional $106,264 |
| Albanians | 95.1 /100 | #117 | Exceptional $106,243 |
| Immigrants | Western Asia | 95.0 /100 | #118 | Exceptional $106,217 |
| Immigrants | Jordan | 94.9 /100 | #119 | Exceptional $106,164 |
| Immigrants | South Eastern Asia | 94.8 /100 | #120 | Exceptional $106,109 |
| Poles | 94.4 /100 | #121 | Exceptional $105,952 |
| Immigrants | North Macedonia | 94.2 /100 | #122 | Exceptional $105,892 |
| Danes | 93.4 /100 | #123 | Exceptional $105,619 |
| Immigrants | Northern Africa | 92.8 /100 | #124 | Exceptional $105,430 |
| Pakistanis | 92.4 /100 | #125 | Exceptional $105,317 |
| Portuguese | 92.4 /100 | #126 | Exceptional $105,309 |
| Immigrants | Saudi Arabia | 92.2 /100 | #127 | Exceptional $105,249 |