Immigrants from Yemen vs Belizean Householder Income Ages 45 - 64 years
COMPARE
Immigrants from Yemen
Belizean
Householder Income Ages 45 - 64 years
Householder Income Ages 45 - 64 years Comparison
Immigrants from Yemen
Belizeans
$74,575
HOUSEHOLDER INCOME AGES 45 - 64 YEARS
0.0/ 100
METRIC RATING
340th/ 347
METRIC RANK
$88,684
HOUSEHOLDER INCOME AGES 45 - 64 YEARS
0.3/ 100
METRIC RATING
261st/ 347
METRIC RANK
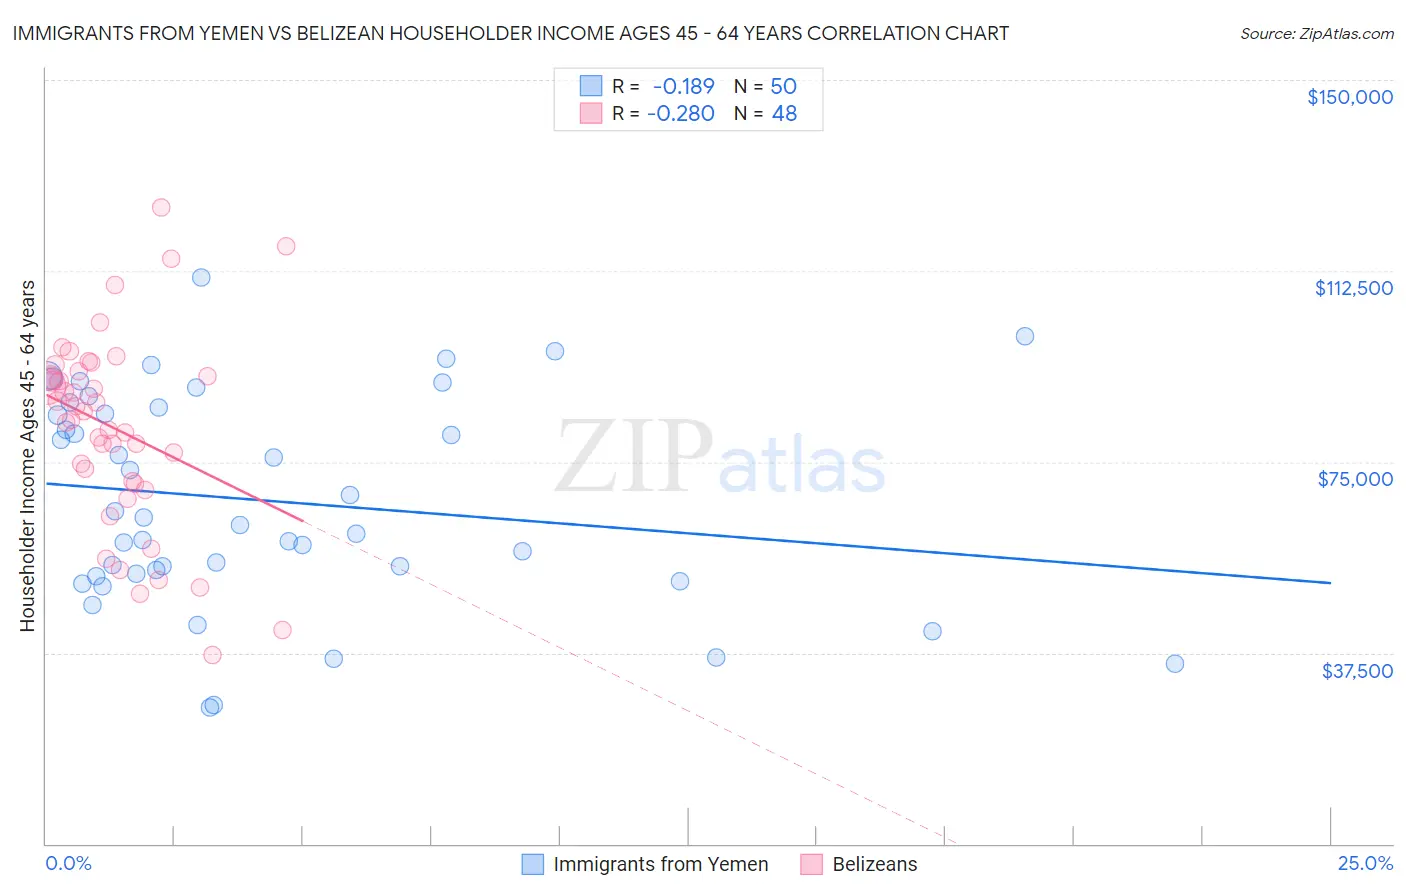
Immigrants from Yemen vs Belizean Householder Income Ages 45 - 64 years Correlation Chart
The statistical analysis conducted on geographies consisting of 82,418,396 people shows a poor negative correlation between the proportion of Immigrants from Yemen and household income with householder between the ages 45 and 64 in the United States with a correlation coefficient (R) of -0.189 and weighted average of $74,575. Similarly, the statistical analysis conducted on geographies consisting of 144,082,540 people shows a weak negative correlation between the proportion of Belizeans and household income with householder between the ages 45 and 64 in the United States with a correlation coefficient (R) of -0.280 and weighted average of $88,684, a difference of 18.9%.
Householder Income Ages 45 - 64 years Correlation Summary
| Measurement | Immigrants from Yemen | Belizean |
| Minimum | $26,815 | $37,000 |
| Maximum | $111,250 | $124,977 |
| Range | $84,435 | $87,977 |
| Mean | $67,361 | $81,502 |
| Median | $63,420 | $84,116 |
| Interquartile 25% (IQ1) | $52,908 | $70,959 |
| Interquartile 75% (IQ3) | $85,795 | $92,338 |
| Interquartile Range (IQR) | $32,887 | $21,379 |
| Standard Deviation (Sample) | $20,711 | $18,999 |
| Standard Deviation (Population) | $20,503 | $18,800 |
Similar Demographics by Householder Income Ages 45 - 64 years
Demographics Similar to Immigrants from Yemen by Householder Income Ages 45 - 64 years
In terms of householder income ages 45 - 64 years, the demographic groups most similar to Immigrants from Yemen are Kiowa ($74,815, a difference of 0.32%), Crow ($74,257, a difference of 0.43%), Tohono O'odham ($73,774, a difference of 1.1%), Hopi ($75,562, a difference of 1.3%), and Pueblo ($75,601, a difference of 1.4%).
| Demographics | Rating | Rank | Householder Income Ages 45 - 64 years |
| Immigrants | Congo | 0.0 /100 | #333 | Tragic $77,850 |
| Menominee | 0.0 /100 | #334 | Tragic $76,903 |
| Cheyenne | 0.0 /100 | #335 | Tragic $76,362 |
| Arapaho | 0.0 /100 | #336 | Tragic $75,945 |
| Pueblo | 0.0 /100 | #337 | Tragic $75,601 |
| Hopi | 0.0 /100 | #338 | Tragic $75,562 |
| Kiowa | 0.0 /100 | #339 | Tragic $74,815 |
| Immigrants | Yemen | 0.0 /100 | #340 | Tragic $74,575 |
| Crow | 0.0 /100 | #341 | Tragic $74,257 |
| Tohono O'odham | 0.0 /100 | #342 | Tragic $73,774 |
| Pima | 0.0 /100 | #343 | Tragic $73,365 |
| Houma | 0.0 /100 | #344 | Tragic $72,093 |
| Navajo | 0.0 /100 | #345 | Tragic $69,759 |
| Puerto Ricans | 0.0 /100 | #346 | Tragic $69,234 |
| Lumbee | 0.0 /100 | #347 | Tragic $65,113 |
Demographics Similar to Belizeans by Householder Income Ages 45 - 64 years
In terms of householder income ages 45 - 64 years, the demographic groups most similar to Belizeans are Somali ($88,600, a difference of 0.090%), Liberian ($88,929, a difference of 0.28%), Immigrants from Senegal ($88,421, a difference of 0.30%), Osage ($88,390, a difference of 0.33%), and Jamaican ($88,327, a difference of 0.40%).
| Demographics | Rating | Rank | Householder Income Ages 45 - 64 years |
| Immigrants | Guyana | 0.6 /100 | #254 | Tragic $90,186 |
| West Indians | 0.5 /100 | #255 | Tragic $89,906 |
| French American Indians | 0.5 /100 | #256 | Tragic $89,811 |
| German Russians | 0.4 /100 | #257 | Tragic $89,398 |
| Immigrants | Barbados | 0.4 /100 | #258 | Tragic $89,394 |
| Immigrants | Nicaragua | 0.4 /100 | #259 | Tragic $89,108 |
| Liberians | 0.3 /100 | #260 | Tragic $88,929 |
| Belizeans | 0.3 /100 | #261 | Tragic $88,684 |
| Somalis | 0.3 /100 | #262 | Tragic $88,600 |
| Immigrants | Senegal | 0.3 /100 | #263 | Tragic $88,421 |
| Osage | 0.3 /100 | #264 | Tragic $88,390 |
| Jamaicans | 0.2 /100 | #265 | Tragic $88,327 |
| Immigrants | West Indies | 0.2 /100 | #266 | Tragic $88,164 |
| Hmong | 0.2 /100 | #267 | Tragic $88,115 |
| Immigrants | Micronesia | 0.2 /100 | #268 | Tragic $87,864 |