Immigrants from Western Europe vs Immigrants from Somalia Householder Income Under 25 years
COMPARE
Immigrants from Western Europe
Immigrants from Somalia
Householder Income Under 25 years
Householder Income Under 25 years Comparison
Immigrants from Western Europe
Immigrants from Somalia
$52,957
HOUSEHOLDER INCOME UNDER 25 YEARS
86.7/ 100
METRIC RATING
145th/ 347
METRIC RANK
$48,135
HOUSEHOLDER INCOME UNDER 25 YEARS
0.0/ 100
METRIC RATING
300th/ 347
METRIC RANK
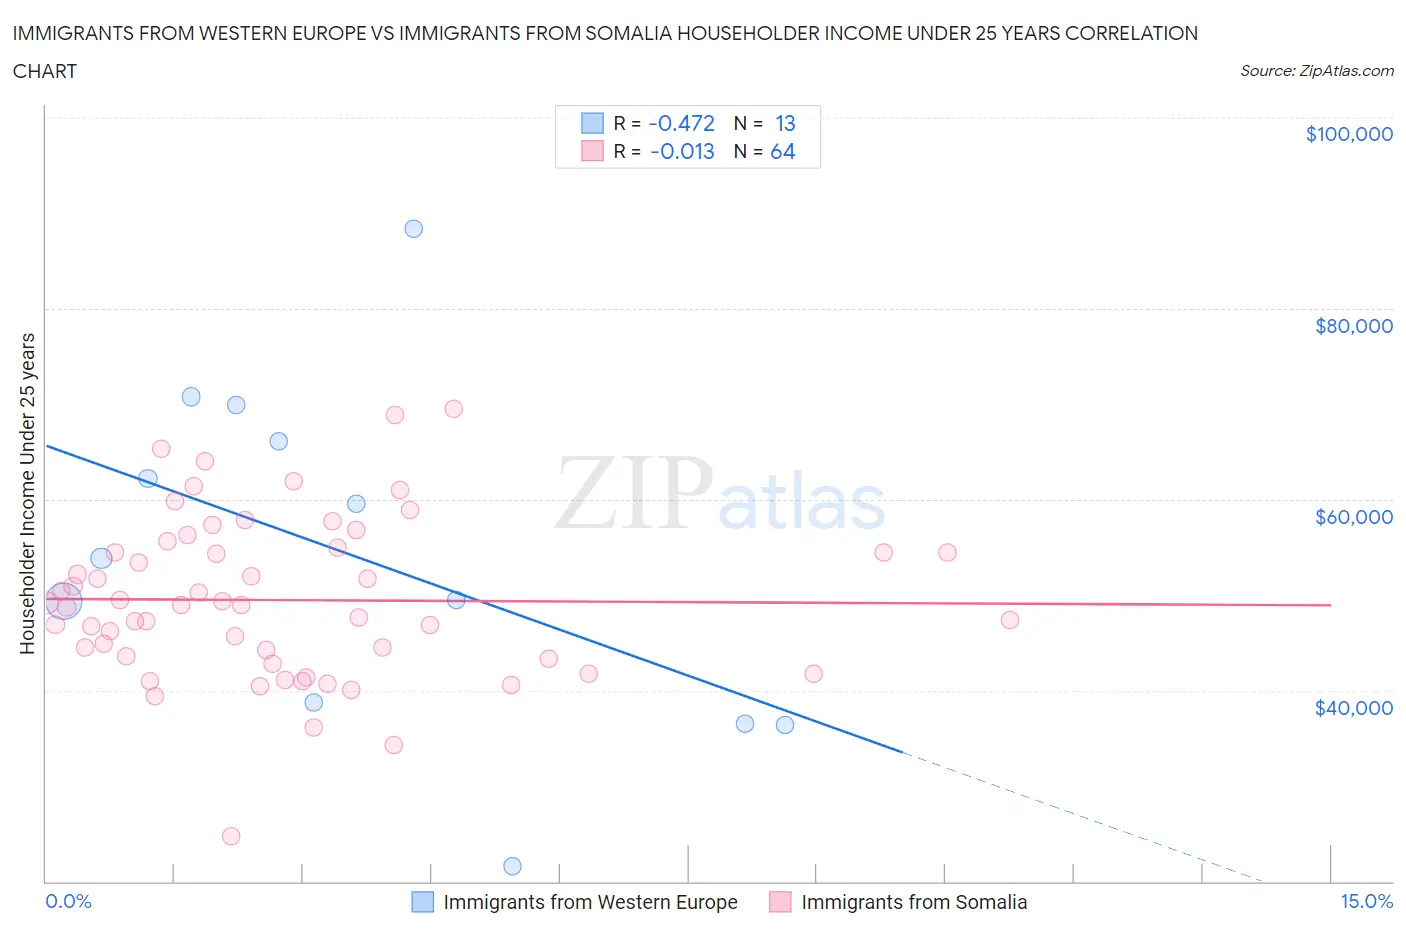
Immigrants from Western Europe vs Immigrants from Somalia Householder Income Under 25 years Correlation Chart
The statistical analysis conducted on geographies consisting of 400,852,129 people shows a moderate negative correlation between the proportion of Immigrants from Western Europe and household income with householder under the age of 25 in the United States with a correlation coefficient (R) of -0.472 and weighted average of $52,957. Similarly, the statistical analysis conducted on geographies consisting of 88,715,511 people shows no correlation between the proportion of Immigrants from Somalia and household income with householder under the age of 25 in the United States with a correlation coefficient (R) of -0.013 and weighted average of $48,135, a difference of 10.0%.
Householder Income Under 25 years Correlation Summary
| Measurement | Immigrants from Western Europe | Immigrants from Somalia |
| Minimum | $21,627 | $24,658 |
| Maximum | $88,400 | $69,432 |
| Range | $66,773 | $44,774 |
| Mean | $54,075 | $49,456 |
| Median | $53,818 | $48,901 |
| Interquartile 25% (IQ1) | $37,651 | $43,459 |
| Interquartile 75% (IQ3) | $68,022 | $54,712 |
| Interquartile Range (IQR) | $30,371 | $11,253 |
| Standard Deviation (Sample) | $18,027 | $8,461 |
| Standard Deviation (Population) | $17,320 | $8,395 |
Similar Demographics by Householder Income Under 25 years
Demographics Similar to Immigrants from Western Europe by Householder Income Under 25 years
In terms of householder income under 25 years, the demographic groups most similar to Immigrants from Western Europe are South American Indian ($52,979, a difference of 0.040%), Immigrants from Armenia ($52,986, a difference of 0.050%), Swedish ($52,986, a difference of 0.050%), Danish ($53,041, a difference of 0.16%), and Hawaiian ($53,078, a difference of 0.23%).
| Demographics | Rating | Rank | Householder Income Under 25 years |
| Norwegians | 90.8 /100 | #138 | Exceptional $53,127 |
| Costa Ricans | 90.4 /100 | #139 | Exceptional $53,106 |
| Hawaiians | 89.8 /100 | #140 | Excellent $53,078 |
| Danes | 88.9 /100 | #141 | Excellent $53,041 |
| Immigrants | Armenia | 87.5 /100 | #142 | Excellent $52,986 |
| Swedes | 87.5 /100 | #143 | Excellent $52,986 |
| South American Indians | 87.3 /100 | #144 | Excellent $52,979 |
| Immigrants | Western Europe | 86.7 /100 | #145 | Excellent $52,957 |
| Immigrants | Hungary | 81.6 /100 | #146 | Excellent $52,798 |
| Latvians | 81.0 /100 | #147 | Excellent $52,783 |
| French Canadians | 76.5 /100 | #148 | Good $52,672 |
| Scandinavians | 75.7 /100 | #149 | Good $52,654 |
| Immigrants | Costa Rica | 75.2 /100 | #150 | Good $52,643 |
| Immigrants | Scotland | 75.0 /100 | #151 | Good $52,638 |
| Trinidadians and Tobagonians | 74.6 /100 | #152 | Good $52,631 |
Demographics Similar to Immigrants from Somalia by Householder Income Under 25 years
In terms of householder income under 25 years, the demographic groups most similar to Immigrants from Somalia are Immigrants from Kuwait ($48,126, a difference of 0.020%), Immigrants from Honduras ($48,267, a difference of 0.27%), Immigrants from Liberia ($47,981, a difference of 0.32%), Yaqui ($48,300, a difference of 0.34%), and Immigrants from Middle Africa ($47,916, a difference of 0.46%).
| Demographics | Rating | Rank | Householder Income Under 25 years |
| Sub-Saharan Africans | 0.0 /100 | #293 | Tragic $48,691 |
| Somalis | 0.0 /100 | #294 | Tragic $48,657 |
| Central American Indians | 0.0 /100 | #295 | Tragic $48,643 |
| Blackfeet | 0.0 /100 | #296 | Tragic $48,603 |
| Cree | 0.0 /100 | #297 | Tragic $48,514 |
| Yaqui | 0.0 /100 | #298 | Tragic $48,300 |
| Immigrants | Honduras | 0.0 /100 | #299 | Tragic $48,267 |
| Immigrants | Somalia | 0.0 /100 | #300 | Tragic $48,135 |
| Immigrants | Kuwait | 0.0 /100 | #301 | Tragic $48,126 |
| Immigrants | Liberia | 0.0 /100 | #302 | Tragic $47,981 |
| Immigrants | Middle Africa | 0.0 /100 | #303 | Tragic $47,916 |
| Menominee | 0.0 /100 | #304 | Tragic $47,907 |
| Cherokee | 0.0 /100 | #305 | Tragic $47,848 |
| Natives/Alaskans | 0.0 /100 | #306 | Tragic $47,704 |
| Bangladeshis | 0.0 /100 | #307 | Tragic $47,589 |