Immigrants from Western Asia vs Slovene Median Male Earnings
COMPARE
Immigrants from Western Asia
Slovene
Median Male Earnings
Median Male Earnings Comparison
Immigrants from Western Asia
Slovenes
$58,131
MEDIAN MALE EARNINGS
97.3/ 100
METRIC RATING
105th/ 347
METRIC RANK
$57,145
MEDIAN MALE EARNINGS
93.1/ 100
METRIC RATING
123rd/ 347
METRIC RANK
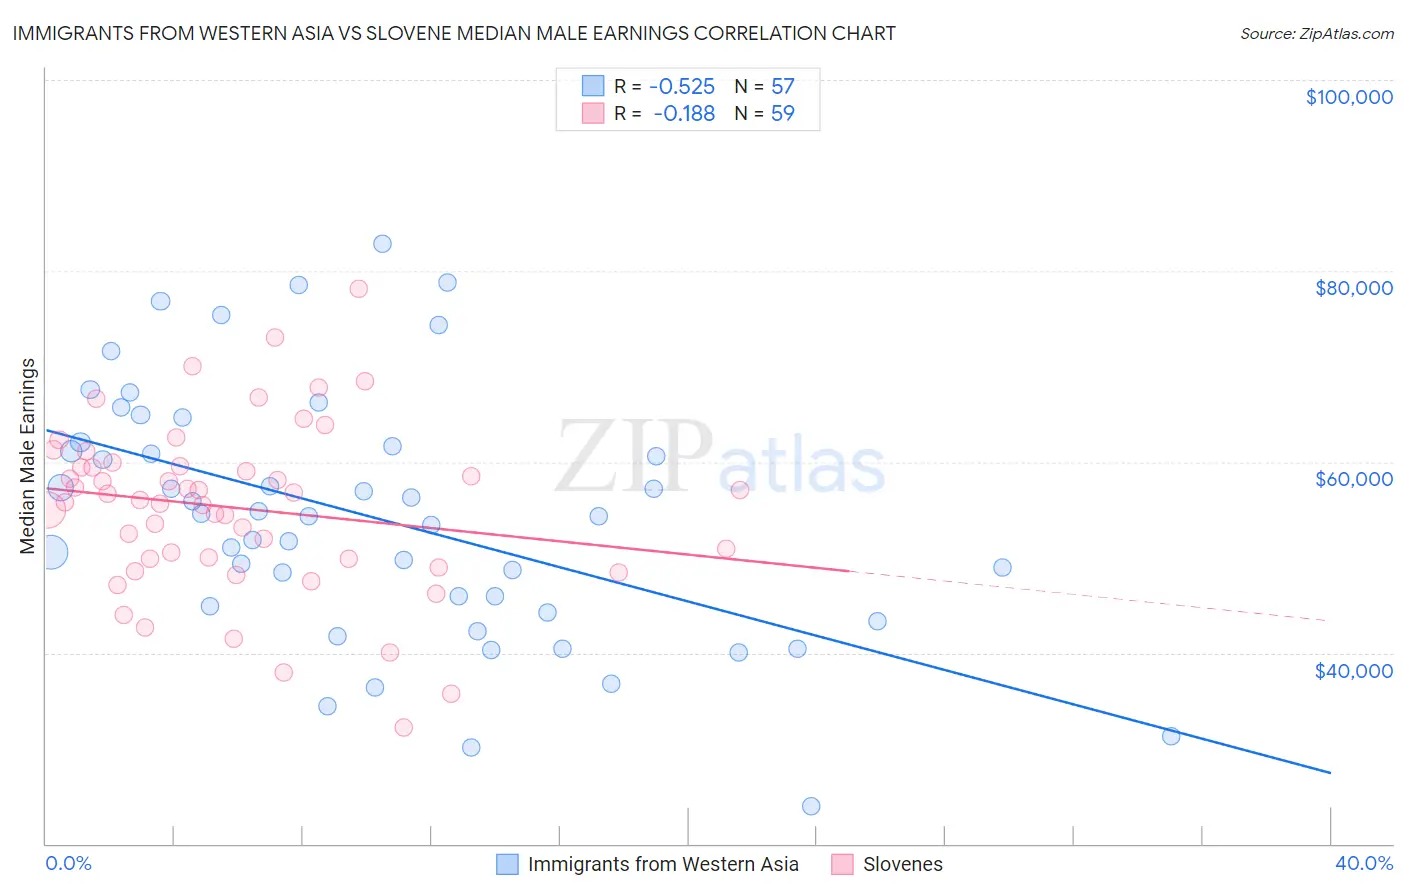
Immigrants from Western Asia vs Slovene Median Male Earnings Correlation Chart
The statistical analysis conducted on geographies consisting of 404,325,600 people shows a substantial negative correlation between the proportion of Immigrants from Western Asia and median male earnings in the United States with a correlation coefficient (R) of -0.525 and weighted average of $58,131. Similarly, the statistical analysis conducted on geographies consisting of 261,314,630 people shows a poor negative correlation between the proportion of Slovenes and median male earnings in the United States with a correlation coefficient (R) of -0.188 and weighted average of $57,145, a difference of 1.7%.
Median Male Earnings Correlation Summary
| Measurement | Immigrants from Western Asia | Slovene |
| Minimum | $23,930 | $32,166 |
| Maximum | $82,862 | $78,136 |
| Range | $58,932 | $45,970 |
| Mean | $54,093 | $55,159 |
| Median | $54,361 | $56,030 |
| Interquartile 25% (IQ1) | $44,525 | $49,853 |
| Interquartile 75% (IQ3) | $61,864 | $59,556 |
| Interquartile Range (IQR) | $17,339 | $9,703 |
| Standard Deviation (Sample) | $13,096 | $8,904 |
| Standard Deviation (Population) | $12,981 | $8,828 |
Demographics Similar to Immigrants from Western Asia and Slovenes by Median Male Earnings
In terms of median male earnings, the demographic groups most similar to Immigrants from Western Asia are Armenian ($58,134, a difference of 0.010%), Immigrants from Northern Africa ($58,008, a difference of 0.21%), Serbian ($57,975, a difference of 0.27%), Immigrants from Uzbekistan ($57,941, a difference of 0.33%), and British ($57,890, a difference of 0.42%). Similarly, the demographic groups most similar to Slovenes are Immigrants from Jordan ($57,145, a difference of 0.0%), Immigrants from Albania ($57,179, a difference of 0.060%), Canadian ($57,286, a difference of 0.25%), Arab ($57,298, a difference of 0.27%), and Hungarian ($57,309, a difference of 0.29%).
| Demographics | Rating | Rank | Median Male Earnings |
| Armenians | 97.3 /100 | #104 | Exceptional $58,134 |
| Immigrants | Western Asia | 97.3 /100 | #105 | Exceptional $58,131 |
| Immigrants | Northern Africa | 96.9 /100 | #106 | Exceptional $58,008 |
| Serbians | 96.8 /100 | #107 | Exceptional $57,975 |
| Immigrants | Uzbekistan | 96.7 /100 | #108 | Exceptional $57,941 |
| British | 96.5 /100 | #109 | Exceptional $57,890 |
| Palestinians | 96.2 /100 | #110 | Exceptional $57,778 |
| Europeans | 95.6 /100 | #111 | Exceptional $57,637 |
| Immigrants | Afghanistan | 95.4 /100 | #112 | Exceptional $57,582 |
| Carpatho Rusyns | 95.3 /100 | #113 | Exceptional $57,572 |
| Immigrants | Kuwait | 95.3 /100 | #114 | Exceptional $57,562 |
| Swedes | 94.8 /100 | #115 | Exceptional $57,445 |
| Lebanese | 94.6 /100 | #116 | Exceptional $57,409 |
| Immigrants | Zimbabwe | 94.3 /100 | #117 | Exceptional $57,352 |
| Hungarians | 94.0 /100 | #118 | Exceptional $57,309 |
| Arabs | 94.0 /100 | #119 | Exceptional $57,298 |
| Canadians | 93.9 /100 | #120 | Exceptional $57,286 |
| Immigrants | Albania | 93.3 /100 | #121 | Exceptional $57,179 |
| Immigrants | Jordan | 93.1 /100 | #122 | Exceptional $57,145 |
| Slovenes | 93.1 /100 | #123 | Exceptional $57,145 |
| Chileans | 91.9 /100 | #124 | Exceptional $56,973 |