Immigrants from West Indies vs Mexican American Indian Householder Income Under 25 years
COMPARE
Immigrants from West Indies
Mexican American Indian
Householder Income Under 25 years
Householder Income Under 25 years Comparison
Immigrants from West Indies
Mexican American Indians
$51,479
HOUSEHOLDER INCOME UNDER 25 YEARS
14.9/ 100
METRIC RATING
200th/ 347
METRIC RANK
$51,783
HOUSEHOLDER INCOME UNDER 25 YEARS
27.0/ 100
METRIC RATING
183rd/ 347
METRIC RANK
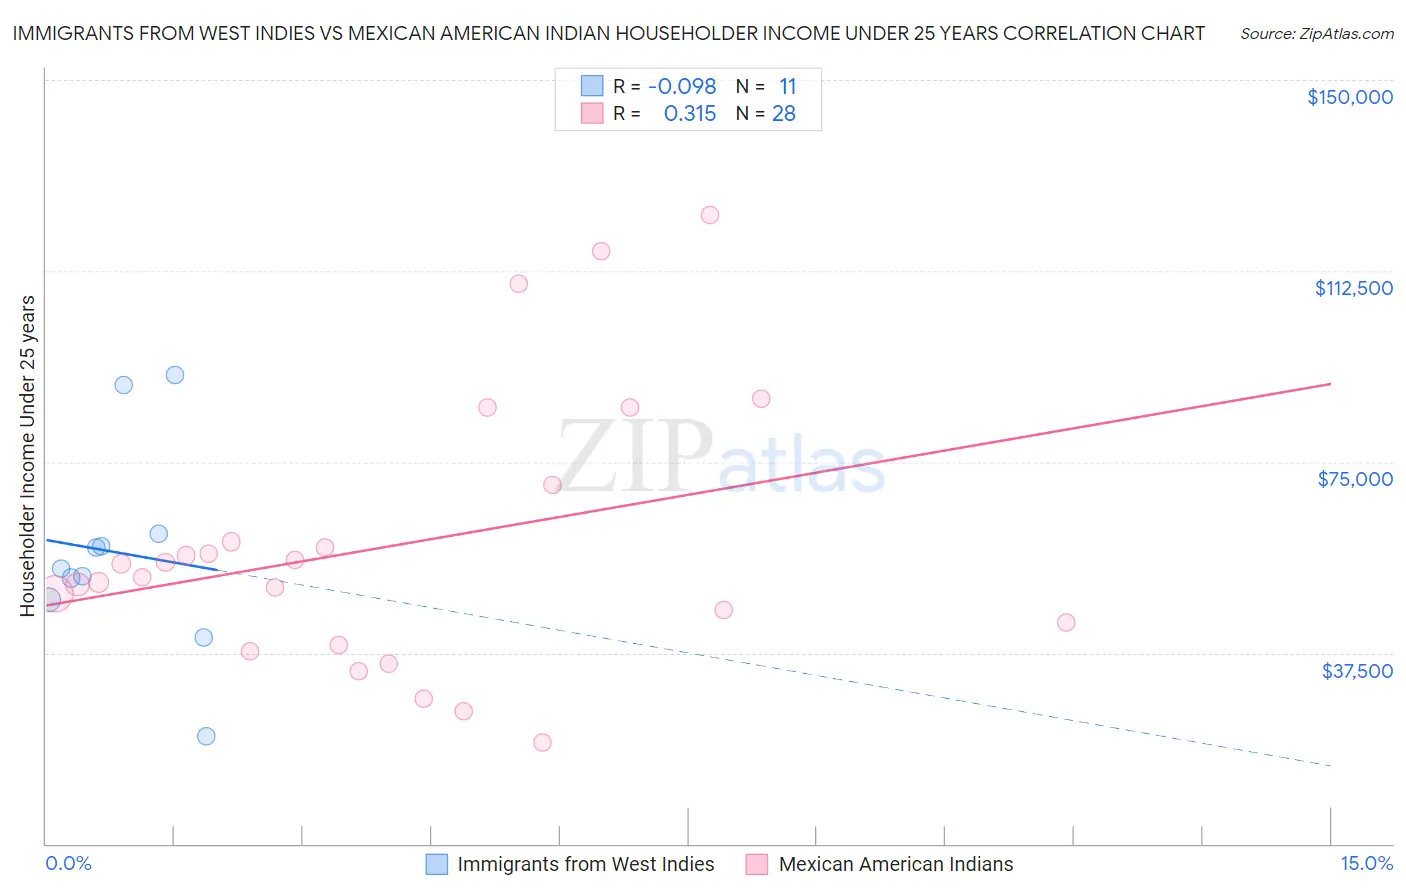
Immigrants from West Indies vs Mexican American Indian Householder Income Under 25 years Correlation Chart
The statistical analysis conducted on geographies consisting of 67,649,285 people shows a slight negative correlation between the proportion of Immigrants from West Indies and household income with householder under the age of 25 in the United States with a correlation coefficient (R) of -0.098 and weighted average of $51,479. Similarly, the statistical analysis conducted on geographies consisting of 281,148,654 people shows a mild positive correlation between the proportion of Mexican American Indians and household income with householder under the age of 25 in the United States with a correlation coefficient (R) of 0.315 and weighted average of $51,783, a difference of 0.59%.
Householder Income Under 25 years Correlation Summary
| Measurement | Immigrants from West Indies | Mexican American Indian |
| Minimum | $21,217 | $20,000 |
| Maximum | $92,155 | $123,444 |
| Range | $70,938 | $103,444 |
| Mean | $57,077 | $58,543 |
| Median | $54,070 | $53,633 |
| Interquartile 25% (IQ1) | $47,937 | $41,184 |
| Interquartile 75% (IQ3) | $60,906 | $64,825 |
| Interquartile Range (IQR) | $12,968 | $23,640 |
| Standard Deviation (Sample) | $20,093 | $26,373 |
| Standard Deviation (Population) | $19,158 | $25,898 |
Demographics Similar to Immigrants from West Indies and Mexican American Indians by Householder Income Under 25 years
In terms of householder income under 25 years, the demographic groups most similar to Immigrants from West Indies are British ($51,477, a difference of 0.0%), Immigrants from Syria ($51,494, a difference of 0.030%), Swiss ($51,493, a difference of 0.030%), Pima ($51,503, a difference of 0.050%), and Palestinian ($51,515, a difference of 0.070%). Similarly, the demographic groups most similar to Mexican American Indians are European ($51,796, a difference of 0.030%), Jordanian ($51,796, a difference of 0.030%), Paiute ($51,743, a difference of 0.080%), Immigrants from Latvia ($51,737, a difference of 0.090%), and Alaskan Athabascan ($51,713, a difference of 0.13%).
| Demographics | Rating | Rank | Householder Income Under 25 years |
| Europeans | 27.6 /100 | #181 | Fair $51,796 |
| Jordanians | 27.6 /100 | #182 | Fair $51,796 |
| Mexican American Indians | 27.0 /100 | #183 | Fair $51,783 |
| Paiute | 25.1 /100 | #184 | Fair $51,743 |
| Immigrants | Latvia | 24.8 /100 | #185 | Fair $51,737 |
| Alaskan Athabascans | 23.8 /100 | #186 | Fair $51,713 |
| Immigrants | South Africa | 23.4 /100 | #187 | Fair $51,705 |
| Northern Europeans | 22.2 /100 | #188 | Fair $51,678 |
| Croatians | 21.6 /100 | #189 | Fair $51,662 |
| Malaysians | 19.7 /100 | #190 | Poor $51,615 |
| Panamanians | 19.5 /100 | #191 | Poor $51,611 |
| West Indians | 18.5 /100 | #192 | Poor $51,583 |
| Immigrants | Eritrea | 18.1 /100 | #193 | Poor $51,574 |
| Guatemalans | 16.4 /100 | #194 | Poor $51,525 |
| Estonians | 16.4 /100 | #195 | Poor $51,523 |
| Palestinians | 16.1 /100 | #196 | Poor $51,515 |
| Pima | 15.7 /100 | #197 | Poor $51,503 |
| Immigrants | Syria | 15.4 /100 | #198 | Poor $51,494 |
| Swiss | 15.4 /100 | #199 | Poor $51,493 |
| Immigrants | West Indies | 14.9 /100 | #200 | Poor $51,479 |
| British | 14.9 /100 | #201 | Poor $51,477 |