Immigrants from Venezuela vs Fijian Median Family Income
COMPARE
Immigrants from Venezuela
Fijian
Median Family Income
Median Family Income Comparison
Immigrants from Venezuela
Fijians
$94,904
MEDIAN FAMILY INCOME
1.9/ 100
METRIC RATING
232nd/ 347
METRIC RANK
$87,387
MEDIAN FAMILY INCOME
0.0/ 100
METRIC RATING
294th/ 347
METRIC RANK
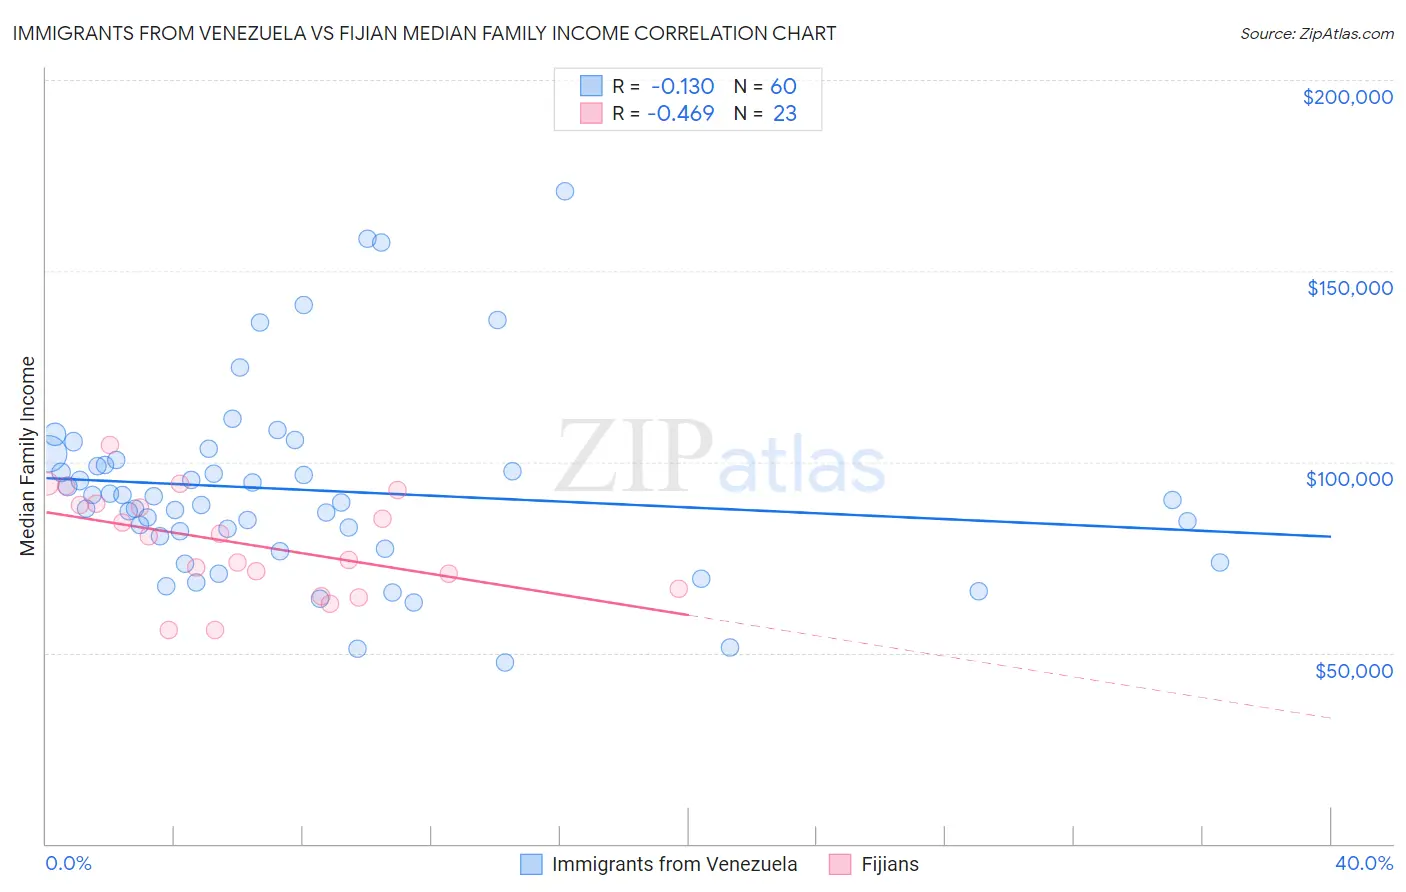
Immigrants from Venezuela vs Fijian Median Family Income Correlation Chart
The statistical analysis conducted on geographies consisting of 287,745,921 people shows a poor negative correlation between the proportion of Immigrants from Venezuela and median family income in the United States with a correlation coefficient (R) of -0.130 and weighted average of $94,904. Similarly, the statistical analysis conducted on geographies consisting of 55,946,812 people shows a moderate negative correlation between the proportion of Fijians and median family income in the United States with a correlation coefficient (R) of -0.469 and weighted average of $87,387, a difference of 8.6%.
Median Family Income Correlation Summary
| Measurement | Immigrants from Venezuela | Fijian |
| Minimum | $47,465 | $55,821 |
| Maximum | $170,845 | $104,335 |
| Range | $123,380 | $48,514 |
| Mean | $92,607 | $78,636 |
| Median | $89,644 | $80,363 |
| Interquartile 25% (IQ1) | $78,947 | $66,750 |
| Interquartile 75% (IQ3) | $99,865 | $89,066 |
| Interquartile Range (IQR) | $20,918 | $22,316 |
| Standard Deviation (Sample) | $24,843 | $13,442 |
| Standard Deviation (Population) | $24,635 | $13,146 |
Similar Demographics by Median Family Income
Demographics Similar to Immigrants from Venezuela by Median Family Income
In terms of median family income, the demographic groups most similar to Immigrants from Venezuela are Ecuadorian ($95,114, a difference of 0.22%), Immigrants from Bangladesh ($94,665, a difference of 0.25%), Immigrants from Western Africa ($94,638, a difference of 0.28%), Malaysian ($95,230, a difference of 0.34%), and Marshallese ($95,293, a difference of 0.41%).
| Demographics | Rating | Rank | Median Family Income |
| Vietnamese | 3.4 /100 | #225 | Tragic $96,123 |
| Immigrants | Panama | 2.7 /100 | #226 | Tragic $95,647 |
| Alaska Natives | 2.6 /100 | #227 | Tragic $95,573 |
| Immigrants | Azores | 2.4 /100 | #228 | Tragic $95,402 |
| Marshallese | 2.2 /100 | #229 | Tragic $95,293 |
| Malaysians | 2.2 /100 | #230 | Tragic $95,230 |
| Ecuadorians | 2.1 /100 | #231 | Tragic $95,114 |
| Immigrants | Venezuela | 1.9 /100 | #232 | Tragic $94,904 |
| Immigrants | Bangladesh | 1.6 /100 | #233 | Tragic $94,665 |
| Immigrants | Western Africa | 1.6 /100 | #234 | Tragic $94,638 |
| Immigrants | Burma/Myanmar | 1.5 /100 | #235 | Tragic $94,472 |
| Trinidadians and Tobagonians | 1.5 /100 | #236 | Tragic $94,466 |
| Alaskan Athabascans | 1.5 /100 | #237 | Tragic $94,429 |
| Nepalese | 1.3 /100 | #238 | Tragic $94,153 |
| Salvadorans | 1.2 /100 | #239 | Tragic $94,109 |
Demographics Similar to Fijians by Median Family Income
In terms of median family income, the demographic groups most similar to Fijians are Yaqui ($87,289, a difference of 0.11%), Immigrants from Guatemala ($87,191, a difference of 0.22%), Ute ($87,596, a difference of 0.24%), Cajun ($87,157, a difference of 0.26%), and Immigrants from Latin America ($86,989, a difference of 0.46%).
| Demographics | Rating | Rank | Median Family Income |
| Potawatomi | 0.1 /100 | #287 | Tragic $88,265 |
| Cherokee | 0.1 /100 | #288 | Tragic $88,209 |
| Central American Indians | 0.1 /100 | #289 | Tragic $88,034 |
| Shoshone | 0.1 /100 | #290 | Tragic $87,872 |
| Immigrants | Cabo Verde | 0.1 /100 | #291 | Tragic $87,830 |
| Africans | 0.1 /100 | #292 | Tragic $87,820 |
| Ute | 0.0 /100 | #293 | Tragic $87,596 |
| Fijians | 0.0 /100 | #294 | Tragic $87,387 |
| Yaqui | 0.0 /100 | #295 | Tragic $87,289 |
| Immigrants | Guatemala | 0.0 /100 | #296 | Tragic $87,191 |
| Cajuns | 0.0 /100 | #297 | Tragic $87,157 |
| Immigrants | Latin America | 0.0 /100 | #298 | Tragic $86,989 |
| Chippewa | 0.0 /100 | #299 | Tragic $86,852 |
| Ottawa | 0.0 /100 | #300 | Tragic $86,380 |
| Colville | 0.0 /100 | #301 | Tragic $85,792 |