Immigrants from Ukraine vs Immigrants from North America Householder Income Under 25 years
COMPARE
Immigrants from Ukraine
Immigrants from North America
Householder Income Under 25 years
Householder Income Under 25 years Comparison
Immigrants from Ukraine
Immigrants from North America
$55,447
HOUSEHOLDER INCOME UNDER 25 YEARS
100.0/ 100
METRIC RATING
55th/ 347
METRIC RANK
$53,307
HOUSEHOLDER INCOME UNDER 25 YEARS
93.9/ 100
METRIC RATING
127th/ 347
METRIC RANK
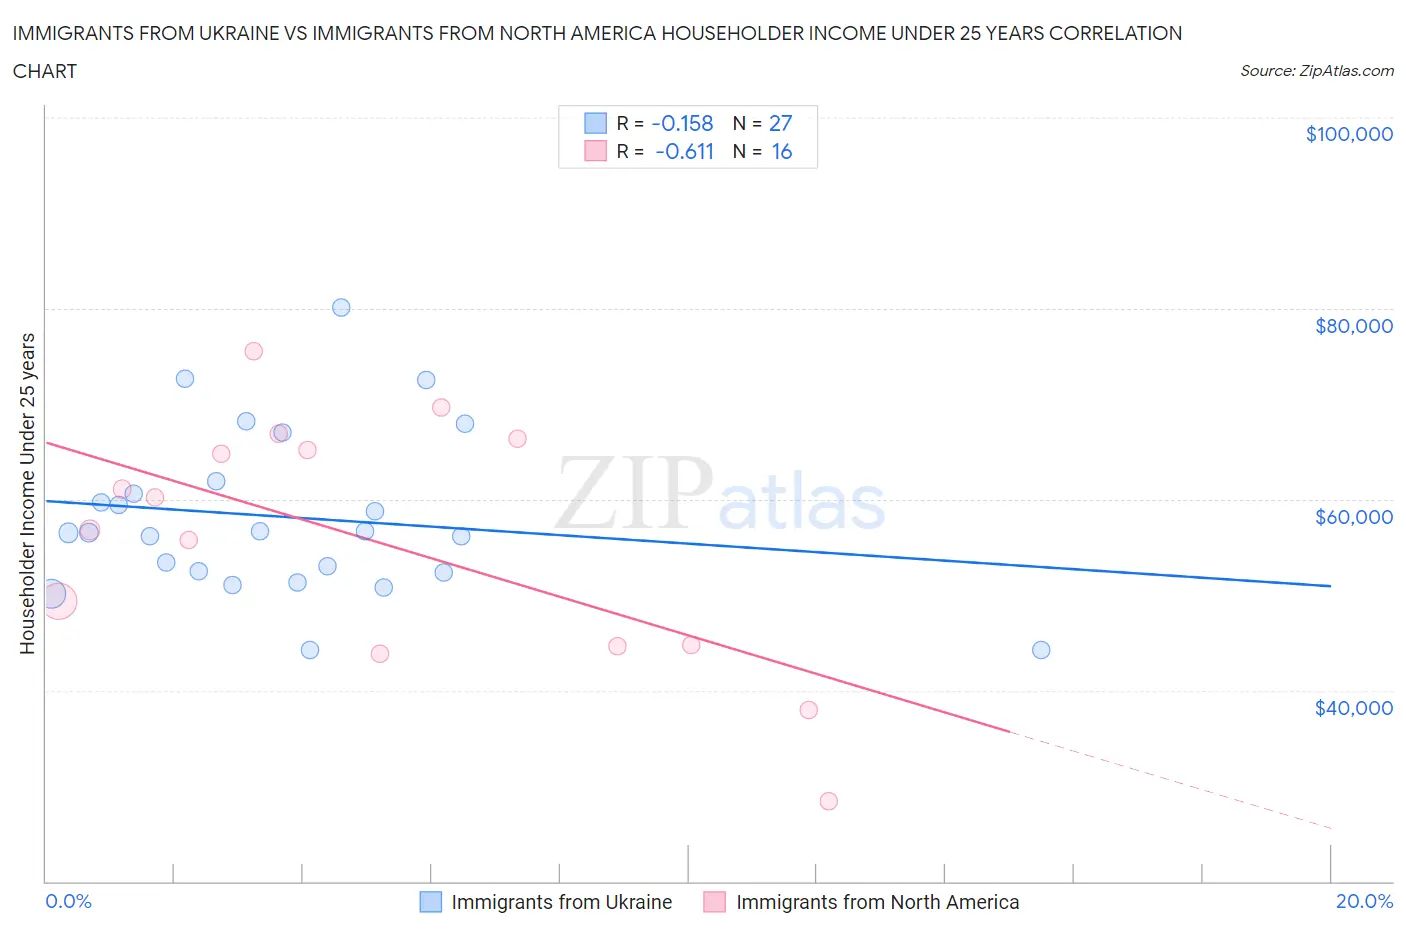
Immigrants from Ukraine vs Immigrants from North America Householder Income Under 25 years Correlation Chart
The statistical analysis conducted on geographies consisting of 247,734,480 people shows a poor negative correlation between the proportion of Immigrants from Ukraine and household income with householder under the age of 25 in the United States with a correlation coefficient (R) of -0.158 and weighted average of $55,447. Similarly, the statistical analysis conducted on geographies consisting of 377,658,786 people shows a significant negative correlation between the proportion of Immigrants from North America and household income with householder under the age of 25 in the United States with a correlation coefficient (R) of -0.611 and weighted average of $53,307, a difference of 4.0%.
Householder Income Under 25 years Correlation Summary
| Measurement | Immigrants from Ukraine | Immigrants from North America |
| Minimum | $44,212 | $28,317 |
| Maximum | $80,041 | $75,531 |
| Range | $35,830 | $47,214 |
| Mean | $58,153 | $55,688 |
| Median | $56,546 | $58,508 |
| Interquartile 25% (IQ1) | $52,321 | $44,648 |
| Interquartile 75% (IQ3) | $61,864 | $65,806 |
| Interquartile Range (IQR) | $9,543 | $21,158 |
| Standard Deviation (Sample) | $8,615 | $13,014 |
| Standard Deviation (Population) | $8,454 | $12,601 |
Similar Demographics by Householder Income Under 25 years
Demographics Similar to Immigrants from Ukraine by Householder Income Under 25 years
In terms of householder income under 25 years, the demographic groups most similar to Immigrants from Ukraine are Sri Lankan ($55,470, a difference of 0.040%), Immigrants from Poland ($55,474, a difference of 0.050%), Salvadoran ($55,412, a difference of 0.060%), Immigrants from Romania ($55,522, a difference of 0.13%), and Immigrants from Indonesia ($55,521, a difference of 0.13%).
| Demographics | Rating | Rank | Householder Income Under 25 years |
| Immigrants | Vietnam | 100.0 /100 | #48 | Exceptional $55,562 |
| Iranians | 100.0 /100 | #49 | Exceptional $55,548 |
| Puget Sound Salish | 100.0 /100 | #50 | Exceptional $55,543 |
| Immigrants | Romania | 100.0 /100 | #51 | Exceptional $55,522 |
| Immigrants | Indonesia | 100.0 /100 | #52 | Exceptional $55,521 |
| Immigrants | Poland | 100.0 /100 | #53 | Exceptional $55,474 |
| Sri Lankans | 100.0 /100 | #54 | Exceptional $55,470 |
| Immigrants | Ukraine | 100.0 /100 | #55 | Exceptional $55,447 |
| Salvadorans | 100.0 /100 | #56 | Exceptional $55,412 |
| Soviet Union | 100.0 /100 | #57 | Exceptional $55,340 |
| Guyanese | 99.9 /100 | #58 | Exceptional $55,210 |
| Native Hawaiians | 99.9 /100 | #59 | Exceptional $55,158 |
| Immigrants | Lithuania | 99.9 /100 | #60 | Exceptional $55,028 |
| Immigrants | Europe | 99.9 /100 | #61 | Exceptional $55,022 |
| Immigrants | Uzbekistan | 99.8 /100 | #62 | Exceptional $54,846 |
Demographics Similar to Immigrants from North America by Householder Income Under 25 years
In terms of householder income under 25 years, the demographic groups most similar to Immigrants from North America are Immigrants from Bulgaria ($53,305, a difference of 0.0%), New Zealander ($53,294, a difference of 0.020%), Pakistani ($53,325, a difference of 0.030%), Immigrants from Serbia ($53,321, a difference of 0.030%), and Nicaraguan ($53,275, a difference of 0.060%).
| Demographics | Rating | Rank | Householder Income Under 25 years |
| Guamanians/Chamorros | 95.3 /100 | #120 | Exceptional $53,423 |
| Immigrants | Canada | 95.2 /100 | #121 | Exceptional $53,411 |
| Immigrants | Ethiopia | 95.2 /100 | #122 | Exceptional $53,408 |
| Immigrants | Iraq | 94.9 /100 | #123 | Exceptional $53,384 |
| Colombians | 94.6 /100 | #124 | Exceptional $53,357 |
| Pakistanis | 94.1 /100 | #125 | Exceptional $53,325 |
| Immigrants | Serbia | 94.1 /100 | #126 | Exceptional $53,321 |
| Immigrants | North America | 93.9 /100 | #127 | Exceptional $53,307 |
| Immigrants | Bulgaria | 93.9 /100 | #128 | Exceptional $53,305 |
| New Zealanders | 93.7 /100 | #129 | Exceptional $53,294 |
| Nicaraguans | 93.4 /100 | #130 | Exceptional $53,275 |
| Immigrants | Nicaragua | 93.3 /100 | #131 | Exceptional $53,266 |
| Moroccans | 93.1 /100 | #132 | Exceptional $53,256 |
| Immigrants | Immigrants | 92.2 /100 | #133 | Exceptional $53,201 |
| Immigrants | Northern Africa | 91.9 /100 | #134 | Exceptional $53,185 |