Immigrants from Taiwan vs Immigrants from Eastern Africa Householder Income Under 25 years
COMPARE
Immigrants from Taiwan
Immigrants from Eastern Africa
Householder Income Under 25 years
Householder Income Under 25 years Comparison
Immigrants from Taiwan
Immigrants from Eastern Africa
$59,424
HOUSEHOLDER INCOME UNDER 25 YEARS
100.0/ 100
METRIC RATING
4th/ 347
METRIC RANK
$51,158
HOUSEHOLDER INCOME UNDER 25 YEARS
7.4/ 100
METRIC RATING
221st/ 347
METRIC RANK
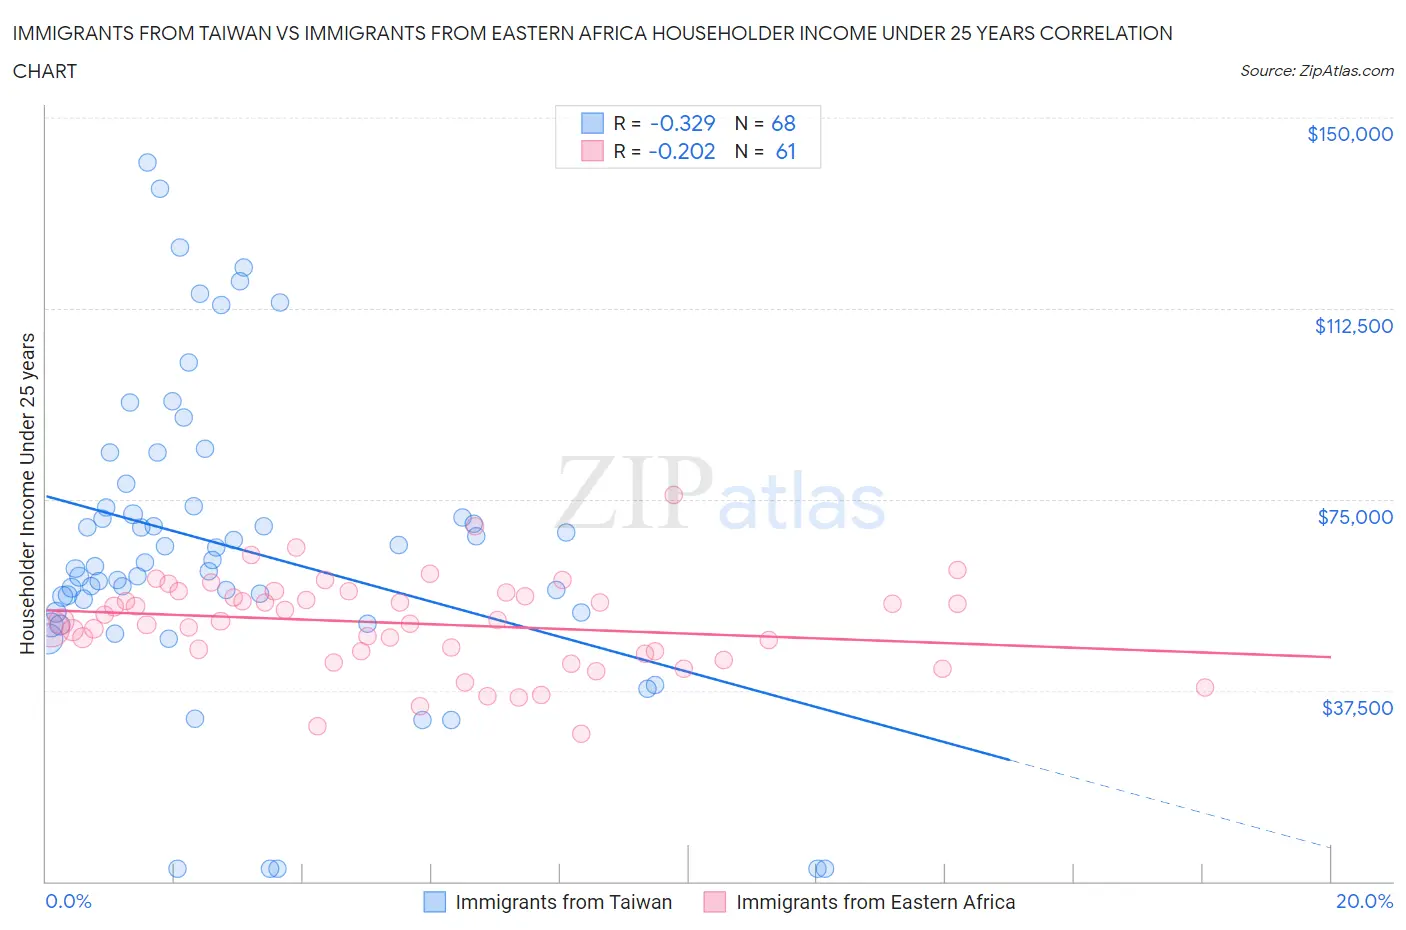
Immigrants from Taiwan vs Immigrants from Eastern Africa Householder Income Under 25 years Correlation Chart
The statistical analysis conducted on geographies consisting of 256,317,565 people shows a mild negative correlation between the proportion of Immigrants from Taiwan and household income with householder under the age of 25 in the United States with a correlation coefficient (R) of -0.329 and weighted average of $59,424. Similarly, the statistical analysis conducted on geographies consisting of 307,584,270 people shows a weak negative correlation between the proportion of Immigrants from Eastern Africa and household income with householder under the age of 25 in the United States with a correlation coefficient (R) of -0.202 and weighted average of $51,158, a difference of 16.2%.
Householder Income Under 25 years Correlation Summary
| Measurement | Immigrants from Taiwan | Immigrants from Eastern Africa |
| Minimum | $2,499 | $29,008 |
| Maximum | $141,202 | $75,954 |
| Range | $138,703 | $46,946 |
| Mean | $65,450 | $50,615 |
| Median | $62,277 | $51,138 |
| Interquartile 25% (IQ1) | $52,778 | $44,850 |
| Interquartile 75% (IQ3) | $73,483 | $56,361 |
| Interquartile Range (IQR) | $20,705 | $11,511 |
| Standard Deviation (Sample) | $29,878 | $9,130 |
| Standard Deviation (Population) | $29,657 | $9,055 |
Similar Demographics by Householder Income Under 25 years
Demographics Similar to Immigrants from Taiwan by Householder Income Under 25 years
In terms of householder income under 25 years, the demographic groups most similar to Immigrants from Taiwan are Immigrants from Bolivia ($59,389, a difference of 0.060%), Thai ($59,187, a difference of 0.40%), Immigrants from India ($59,914, a difference of 0.82%), Bolivian ($58,506, a difference of 1.6%), and Indian (Asian) ($58,239, a difference of 2.0%).
| Demographics | Rating | Rank | Householder Income Under 25 years |
| Assyrians/Chaldeans/Syriacs | 100.0 /100 | #1 | Exceptional $65,329 |
| Immigrants | Hong Kong | 100.0 /100 | #2 | Exceptional $62,083 |
| Immigrants | India | 100.0 /100 | #3 | Exceptional $59,914 |
| Immigrants | Taiwan | 100.0 /100 | #4 | Exceptional $59,424 |
| Immigrants | Bolivia | 100.0 /100 | #5 | Exceptional $59,389 |
| Thais | 100.0 /100 | #6 | Exceptional $59,187 |
| Bolivians | 100.0 /100 | #7 | Exceptional $58,506 |
| Indians (Asian) | 100.0 /100 | #8 | Exceptional $58,239 |
| Chinese | 100.0 /100 | #9 | Exceptional $58,162 |
| Afghans | 100.0 /100 | #10 | Exceptional $58,019 |
| Immigrants | China | 100.0 /100 | #11 | Exceptional $57,931 |
| Immigrants | Philippines | 100.0 /100 | #12 | Exceptional $57,930 |
| Immigrants | South Central Asia | 100.0 /100 | #13 | Exceptional $57,818 |
| Filipinos | 100.0 /100 | #14 | Exceptional $57,740 |
| Koreans | 100.0 /100 | #15 | Exceptional $57,730 |
Demographics Similar to Immigrants from Eastern Africa by Householder Income Under 25 years
In terms of householder income under 25 years, the demographic groups most similar to Immigrants from Eastern Africa are Immigrants from Germany ($51,190, a difference of 0.060%), Spaniard ($51,117, a difference of 0.080%), Serbian ($51,106, a difference of 0.10%), Arab ($51,219, a difference of 0.12%), and Czechoslovakian ($51,224, a difference of 0.13%).
| Demographics | Rating | Rank | Householder Income Under 25 years |
| Zimbabweans | 9.3 /100 | #214 | Tragic $51,259 |
| Icelanders | 9.1 /100 | #215 | Tragic $51,247 |
| French | 8.7 /100 | #216 | Tragic $51,230 |
| Czechoslovakians | 8.6 /100 | #217 | Tragic $51,224 |
| Immigrants | Belize | 8.6 /100 | #218 | Tragic $51,223 |
| Arabs | 8.5 /100 | #219 | Tragic $51,219 |
| Immigrants | Germany | 8.0 /100 | #220 | Tragic $51,190 |
| Immigrants | Eastern Africa | 7.4 /100 | #221 | Tragic $51,158 |
| Spaniards | 6.8 /100 | #222 | Tragic $51,117 |
| Serbians | 6.6 /100 | #223 | Tragic $51,106 |
| Belizeans | 6.4 /100 | #224 | Tragic $51,094 |
| Immigrants | Jamaica | 5.6 /100 | #225 | Tragic $51,038 |
| Yugoslavians | 5.5 /100 | #226 | Tragic $51,028 |
| Immigrants | Central America | 5.4 /100 | #227 | Tragic $51,022 |
| Immigrants | Norway | 5.0 /100 | #228 | Tragic $50,984 |