Immigrants from South Eastern Asia vs Northern European Median Household Income
COMPARE
Immigrants from South Eastern Asia
Northern European
Median Household Income
Median Household Income Comparison
Immigrants from South Eastern Asia
Northern Europeans
$91,541
MEDIAN HOUSEHOLD INCOME
98.4/ 100
METRIC RATING
99th/ 347
METRIC RANK
$90,446
MEDIAN HOUSEHOLD INCOME
96.9/ 100
METRIC RATING
112th/ 347
METRIC RANK
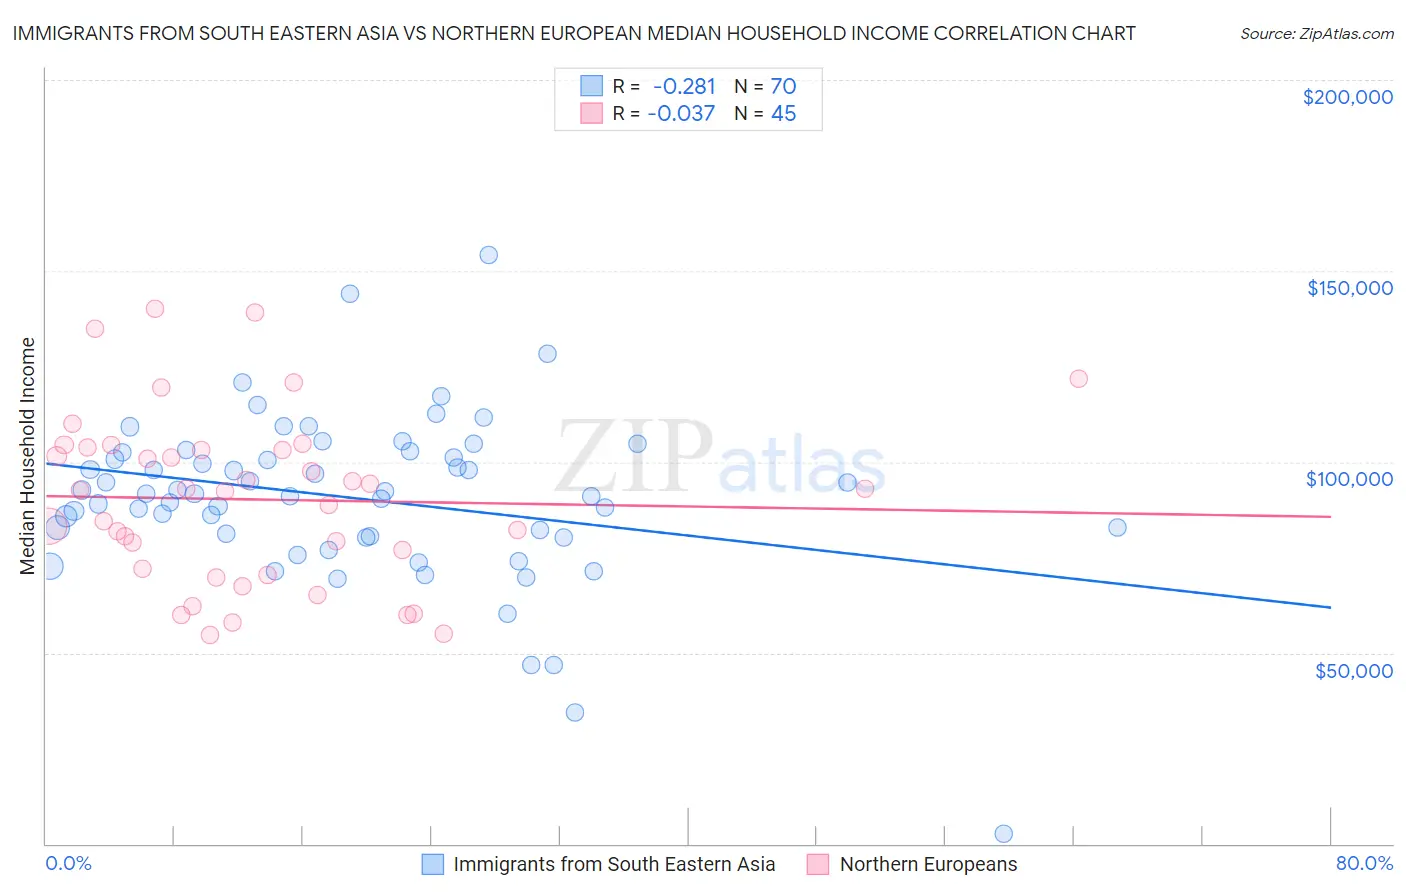
Immigrants from South Eastern Asia vs Northern European Median Household Income Correlation Chart
The statistical analysis conducted on geographies consisting of 511,972,128 people shows a weak negative correlation between the proportion of Immigrants from South Eastern Asia and median household income in the United States with a correlation coefficient (R) of -0.281 and weighted average of $91,541. Similarly, the statistical analysis conducted on geographies consisting of 405,886,183 people shows no correlation between the proportion of Northern Europeans and median household income in the United States with a correlation coefficient (R) of -0.037 and weighted average of $90,446, a difference of 1.2%.
Median Household Income Correlation Summary
| Measurement | Immigrants from South Eastern Asia | Northern European |
| Minimum | $2,499 | $54,809 |
| Maximum | $154,011 | $140,176 |
| Range | $151,512 | $85,367 |
| Mean | $90,562 | $90,148 |
| Median | $91,713 | $92,627 |
| Interquartile 25% (IQ1) | $80,662 | $71,323 |
| Interquartile 75% (IQ3) | $102,441 | $103,516 |
| Interquartile Range (IQR) | $21,780 | $32,192 |
| Standard Deviation (Sample) | $22,276 | $22,235 |
| Standard Deviation (Population) | $22,116 | $21,987 |
Demographics Similar to Immigrants from South Eastern Asia and Northern Europeans by Median Household Income
In terms of median household income, the demographic groups most similar to Immigrants from South Eastern Asia are Immigrants from Southern Europe ($91,605, a difference of 0.070%), Ukrainian ($91,456, a difference of 0.090%), Immigrants from Moldova ($91,446, a difference of 0.10%), Immigrants from Serbia ($91,730, a difference of 0.21%), and Austrian ($91,339, a difference of 0.22%). Similarly, the demographic groups most similar to Northern Europeans are Immigrants from Poland ($90,549, a difference of 0.11%), Palestinian ($90,574, a difference of 0.14%), Chilean ($90,605, a difference of 0.18%), Zimbabwean ($90,618, a difference of 0.19%), and Peruvian ($90,261, a difference of 0.20%).
| Demographics | Rating | Rank | Median Household Income |
| Armenians | 98.7 /100 | #95 | Exceptional $91,807 |
| Jordanians | 98.7 /100 | #96 | Exceptional $91,794 |
| Immigrants | Serbia | 98.6 /100 | #97 | Exceptional $91,730 |
| Immigrants | Southern Europe | 98.5 /100 | #98 | Exceptional $91,605 |
| Immigrants | South Eastern Asia | 98.4 /100 | #99 | Exceptional $91,541 |
| Ukrainians | 98.3 /100 | #100 | Exceptional $91,456 |
| Immigrants | Moldova | 98.3 /100 | #101 | Exceptional $91,446 |
| Austrians | 98.2 /100 | #102 | Exceptional $91,339 |
| Immigrants | Ukraine | 98.0 /100 | #103 | Exceptional $91,124 |
| Immigrants | Kazakhstan | 97.8 /100 | #104 | Exceptional $91,015 |
| Immigrants | Brazil | 97.7 /100 | #105 | Exceptional $90,907 |
| Macedonians | 97.4 /100 | #106 | Exceptional $90,761 |
| Croatians | 97.3 /100 | #107 | Exceptional $90,685 |
| Zimbabweans | 97.2 /100 | #108 | Exceptional $90,618 |
| Chileans | 97.2 /100 | #109 | Exceptional $90,605 |
| Palestinians | 97.1 /100 | #110 | Exceptional $90,574 |
| Immigrants | Poland | 97.1 /100 | #111 | Exceptional $90,549 |
| Northern Europeans | 96.9 /100 | #112 | Exceptional $90,446 |
| Peruvians | 96.5 /100 | #113 | Exceptional $90,261 |
| Immigrants | Northern Africa | 95.9 /100 | #114 | Exceptional $90,026 |
| Immigrants | Western Asia | 95.9 /100 | #115 | Exceptional $90,005 |