Immigrants from Peru vs Malaysian Median Female Earnings
COMPARE
Immigrants from Peru
Malaysian
Median Female Earnings
Median Female Earnings Comparison
Immigrants from Peru
Malaysians
$39,871
MEDIAN FEMALE EARNINGS
58.9/ 100
METRIC RATING
168th/ 347
METRIC RANK
$37,298
MEDIAN FEMALE EARNINGS
0.7/ 100
METRIC RATING
261st/ 347
METRIC RANK
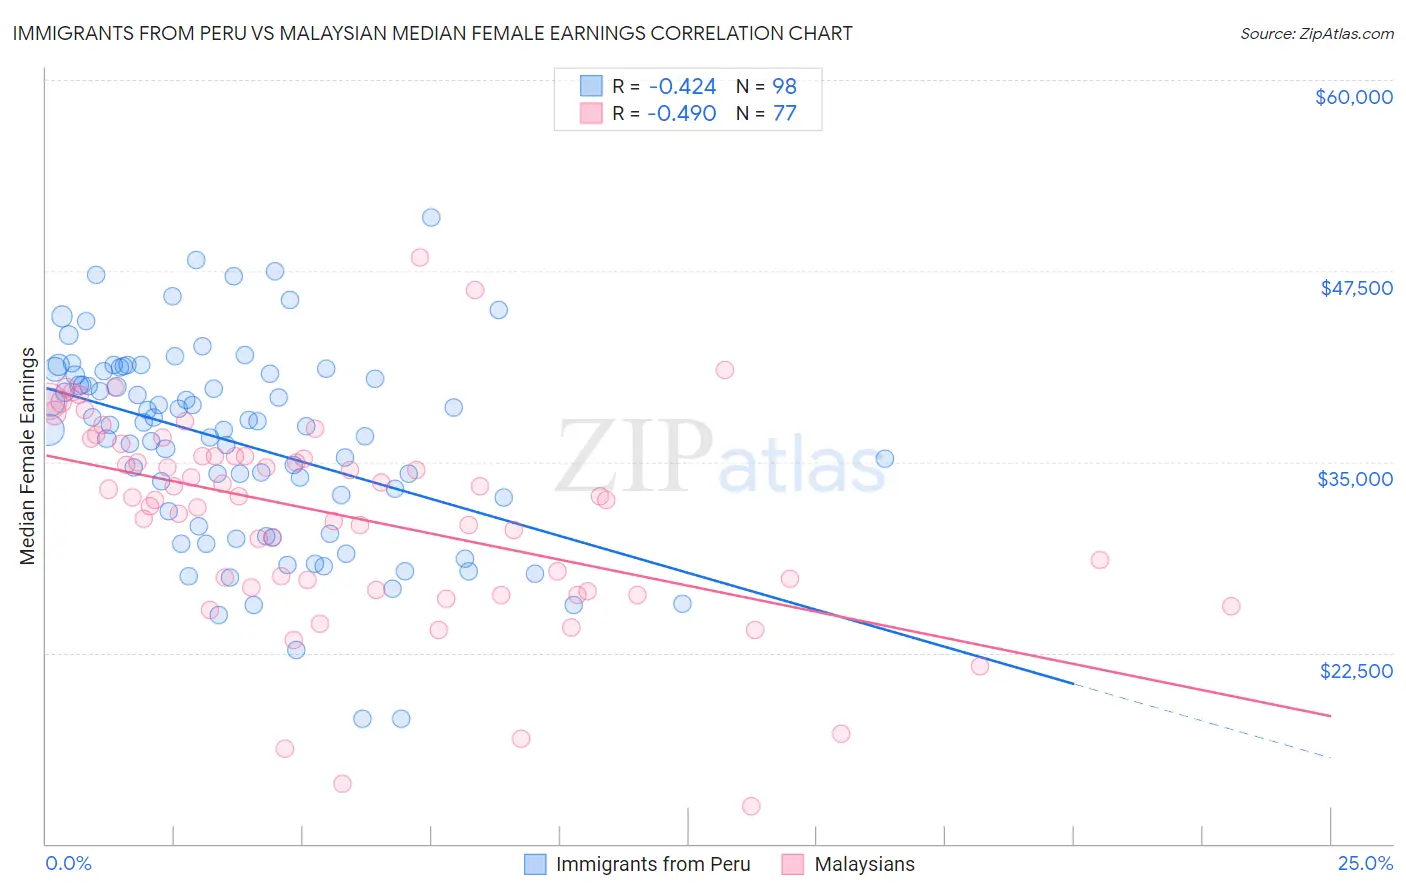
Immigrants from Peru vs Malaysian Median Female Earnings Correlation Chart
The statistical analysis conducted on geographies consisting of 328,788,415 people shows a moderate negative correlation between the proportion of Immigrants from Peru and median female earnings in the United States with a correlation coefficient (R) of -0.424 and weighted average of $39,871. Similarly, the statistical analysis conducted on geographies consisting of 226,078,777 people shows a moderate negative correlation between the proportion of Malaysians and median female earnings in the United States with a correlation coefficient (R) of -0.490 and weighted average of $37,298, a difference of 6.9%.
Median Female Earnings Correlation Summary
| Measurement | Immigrants from Peru | Malaysian |
| Minimum | $18,150 | $12,451 |
| Maximum | $50,975 | $48,393 |
| Range | $32,825 | $35,942 |
| Mean | $36,171 | $31,448 |
| Median | $37,366 | $32,647 |
| Interquartile 25% (IQ1) | $30,816 | $26,696 |
| Interquartile 75% (IQ3) | $40,742 | $35,386 |
| Interquartile Range (IQR) | $9,926 | $8,690 |
| Standard Deviation (Sample) | $6,551 | $6,791 |
| Standard Deviation (Population) | $6,517 | $6,747 |
Similar Demographics by Median Female Earnings
Demographics Similar to Immigrants from Peru by Median Female Earnings
In terms of median female earnings, the demographic groups most similar to Immigrants from Peru are Kenyan ($39,860, a difference of 0.030%), Luxembourger ($39,891, a difference of 0.050%), Immigrants from Ghana ($39,894, a difference of 0.060%), Immigrants from Bangladesh ($39,910, a difference of 0.10%), and Slovene ($39,817, a difference of 0.13%).
| Demographics | Rating | Rank | Median Female Earnings |
| Alsatians | 68.0 /100 | #161 | Good $40,060 |
| South American Indians | 66.1 /100 | #162 | Good $40,019 |
| Lebanese | 65.5 /100 | #163 | Good $40,006 |
| Immigrants | Saudi Arabia | 62.9 /100 | #164 | Good $39,952 |
| Immigrants | Bangladesh | 60.8 /100 | #165 | Good $39,910 |
| Immigrants | Ghana | 60.0 /100 | #166 | Good $39,894 |
| Luxembourgers | 59.9 /100 | #167 | Average $39,891 |
| Immigrants | Peru | 58.9 /100 | #168 | Average $39,871 |
| Kenyans | 58.4 /100 | #169 | Average $39,860 |
| Slovenes | 56.2 /100 | #170 | Average $39,817 |
| Immigrants | Portugal | 54.7 /100 | #171 | Average $39,788 |
| British | 53.8 /100 | #172 | Average $39,772 |
| Canadians | 51.4 /100 | #173 | Average $39,724 |
| South Americans | 50.0 /100 | #174 | Average $39,698 |
| Immigrants | South America | 47.2 /100 | #175 | Average $39,643 |
Demographics Similar to Malaysians by Median Female Earnings
In terms of median female earnings, the demographic groups most similar to Malaysians are Venezuelan ($37,282, a difference of 0.040%), Dutch ($37,339, a difference of 0.11%), Scotch-Irish ($37,383, a difference of 0.23%), Belizean ($37,429, a difference of 0.35%), and German Russian ($37,105, a difference of 0.52%).
| Demographics | Rating | Rank | Median Female Earnings |
| Whites/Caucasians | 1.1 /100 | #254 | Tragic $37,531 |
| Colville | 1.1 /100 | #255 | Tragic $37,514 |
| Samoans | 1.0 /100 | #256 | Tragic $37,498 |
| Hawaiians | 1.0 /100 | #257 | Tragic $37,497 |
| Belizeans | 0.9 /100 | #258 | Tragic $37,429 |
| Scotch-Irish | 0.8 /100 | #259 | Tragic $37,383 |
| Dutch | 0.7 /100 | #260 | Tragic $37,339 |
| Malaysians | 0.7 /100 | #261 | Tragic $37,298 |
| Venezuelans | 0.7 /100 | #262 | Tragic $37,282 |
| German Russians | 0.5 /100 | #263 | Tragic $37,105 |
| Salvadorans | 0.4 /100 | #264 | Tragic $37,083 |
| Immigrants | Belize | 0.4 /100 | #265 | Tragic $37,056 |
| Dominicans | 0.4 /100 | #266 | Tragic $37,046 |
| Immigrants | Nonimmigrants | 0.4 /100 | #267 | Tragic $37,024 |
| Cree | 0.4 /100 | #268 | Tragic $37,018 |