Immigrants from Peru vs Immigrants from Bangladesh Householder Income Over 65 years
COMPARE
Immigrants from Peru
Immigrants from Bangladesh
Householder Income Over 65 years
Householder Income Over 65 years Comparison
Immigrants from Peru
Immigrants from Bangladesh
$61,988
HOUSEHOLDER INCOME OVER 65 YEARS
74.4/ 100
METRIC RATING
144th/ 347
METRIC RANK
$55,394
HOUSEHOLDER INCOME OVER 65 YEARS
0.3/ 100
METRIC RATING
255th/ 347
METRIC RANK
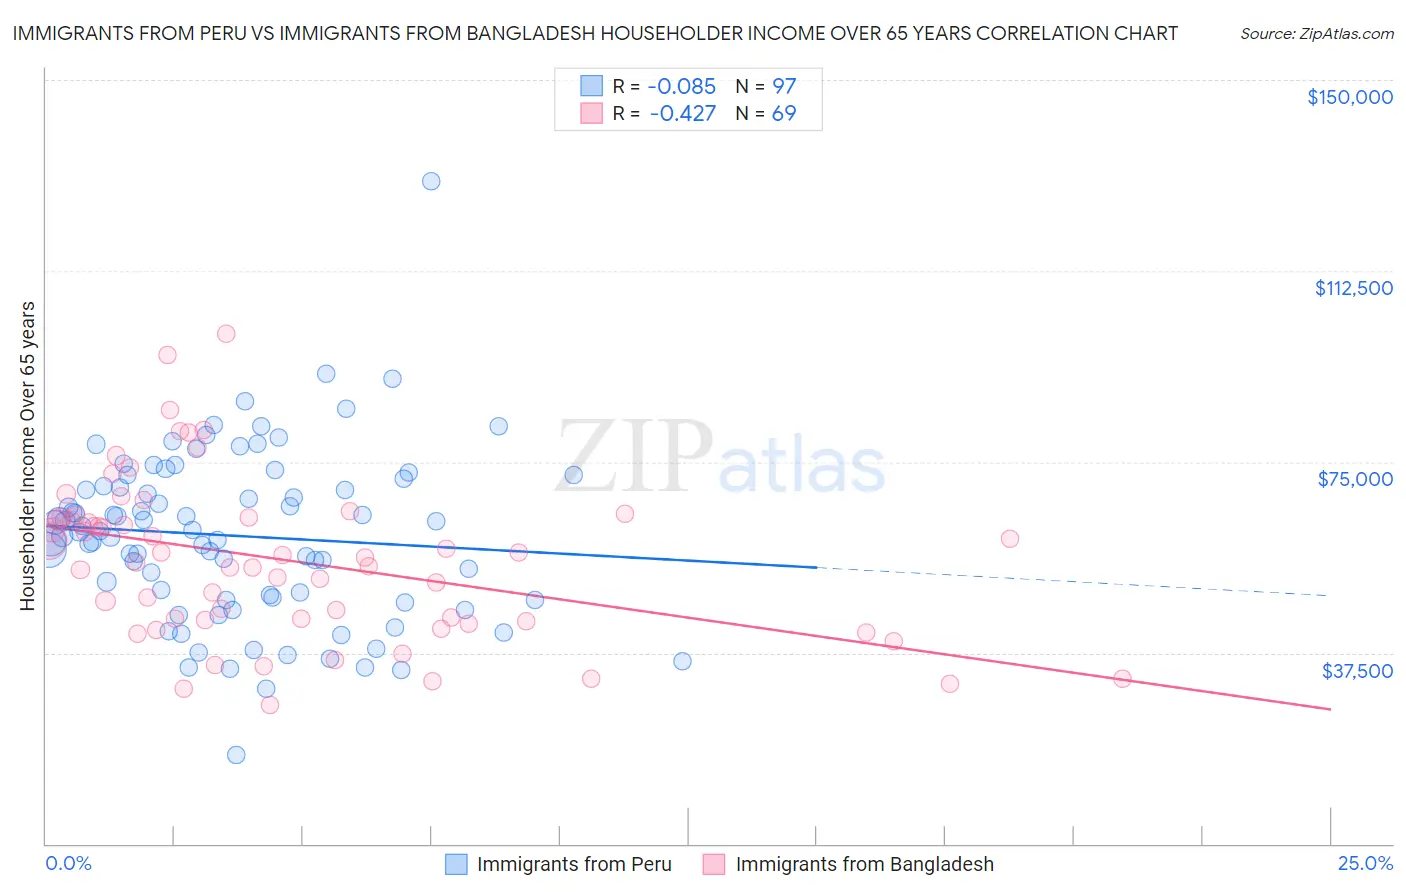
Immigrants from Peru vs Immigrants from Bangladesh Householder Income Over 65 years Correlation Chart
The statistical analysis conducted on geographies consisting of 328,056,605 people shows a slight negative correlation between the proportion of Immigrants from Peru and household income with householder over the age of 65 in the United States with a correlation coefficient (R) of -0.085 and weighted average of $61,988. Similarly, the statistical analysis conducted on geographies consisting of 203,315,091 people shows a moderate negative correlation between the proportion of Immigrants from Bangladesh and household income with householder over the age of 65 in the United States with a correlation coefficient (R) of -0.427 and weighted average of $55,394, a difference of 11.9%.
Householder Income Over 65 years Correlation Summary
| Measurement | Immigrants from Peru | Immigrants from Bangladesh |
| Minimum | $17,361 | $27,321 |
| Maximum | $130,000 | $100,278 |
| Range | $112,639 | $72,957 |
| Mean | $60,475 | $55,731 |
| Median | $61,387 | $56,176 |
| Interquartile 25% (IQ1) | $48,178 | $43,751 |
| Interquartile 75% (IQ3) | $70,945 | $64,071 |
| Interquartile Range (IQR) | $22,768 | $20,321 |
| Standard Deviation (Sample) | $16,737 | $15,711 |
| Standard Deviation (Population) | $16,650 | $15,596 |
Similar Demographics by Householder Income Over 65 years
Demographics Similar to Immigrants from Peru by Householder Income Over 65 years
In terms of householder income over 65 years, the demographic groups most similar to Immigrants from Peru are Immigrants from Uganda ($61,976, a difference of 0.020%), Immigrants from Southern Europe ($61,902, a difference of 0.14%), Immigrants from Nepal ($61,843, a difference of 0.23%), Immigrants from Belarus ($62,162, a difference of 0.28%), and Alsatian ($61,797, a difference of 0.31%).
| Demographics | Rating | Rank | Householder Income Over 65 years |
| Immigrants | Syria | 80.2 /100 | #137 | Excellent $62,303 |
| Immigrants | Kazakhstan | 80.0 /100 | #138 | Excellent $62,292 |
| Lebanese | 79.9 /100 | #139 | Good $62,287 |
| Arabs | 79.6 /100 | #140 | Good $62,266 |
| Canadians | 79.0 /100 | #141 | Good $62,230 |
| South American Indians | 78.7 /100 | #142 | Good $62,215 |
| Immigrants | Belarus | 77.8 /100 | #143 | Good $62,162 |
| Immigrants | Peru | 74.4 /100 | #144 | Good $61,988 |
| Immigrants | Uganda | 74.2 /100 | #145 | Good $61,976 |
| Immigrants | Southern Europe | 72.7 /100 | #146 | Good $61,902 |
| Immigrants | Nepal | 71.4 /100 | #147 | Good $61,843 |
| Alsatians | 70.5 /100 | #148 | Good $61,797 |
| Scottish | 69.1 /100 | #149 | Good $61,735 |
| Slavs | 68.5 /100 | #150 | Good $61,709 |
| Hungarians | 67.7 /100 | #151 | Good $61,673 |
Demographics Similar to Immigrants from Bangladesh by Householder Income Over 65 years
In terms of householder income over 65 years, the demographic groups most similar to Immigrants from Bangladesh are German Russian ($55,356, a difference of 0.070%), Trinidadian and Tobagonian ($55,327, a difference of 0.12%), American ($55,527, a difference of 0.24%), Immigrants from Trinidad and Tobago ($55,598, a difference of 0.37%), and Osage ($55,677, a difference of 0.51%).
| Demographics | Rating | Rank | Householder Income Over 65 years |
| Vietnamese | 0.6 /100 | #248 | Tragic $56,143 |
| Mexican American Indians | 0.6 /100 | #249 | Tragic $56,089 |
| Immigrants | Bosnia and Herzegovina | 0.5 /100 | #250 | Tragic $55,986 |
| Immigrants | Portugal | 0.5 /100 | #251 | Tragic $55,924 |
| Osage | 0.4 /100 | #252 | Tragic $55,677 |
| Immigrants | Trinidad and Tobago | 0.4 /100 | #253 | Tragic $55,598 |
| Americans | 0.3 /100 | #254 | Tragic $55,527 |
| Immigrants | Bangladesh | 0.3 /100 | #255 | Tragic $55,394 |
| German Russians | 0.3 /100 | #256 | Tragic $55,356 |
| Trinidadians and Tobagonians | 0.3 /100 | #257 | Tragic $55,327 |
| Ecuadorians | 0.2 /100 | #258 | Tragic $54,958 |
| West Indians | 0.2 /100 | #259 | Tragic $54,936 |
| Immigrants | West Indies | 0.2 /100 | #260 | Tragic $54,927 |
| Comanche | 0.2 /100 | #261 | Tragic $54,922 |
| Bangladeshis | 0.1 /100 | #262 | Tragic $54,719 |