Immigrants from Panama vs Estonian Householder Income Under 25 years
COMPARE
Immigrants from Panama
Estonian
Householder Income Under 25 years
Householder Income Under 25 years Comparison
Immigrants from Panama
Estonians
$51,278
HOUSEHOLDER INCOME UNDER 25 YEARS
9.7/ 100
METRIC RATING
212th/ 347
METRIC RANK
$51,523
HOUSEHOLDER INCOME UNDER 25 YEARS
16.4/ 100
METRIC RATING
195th/ 347
METRIC RANK
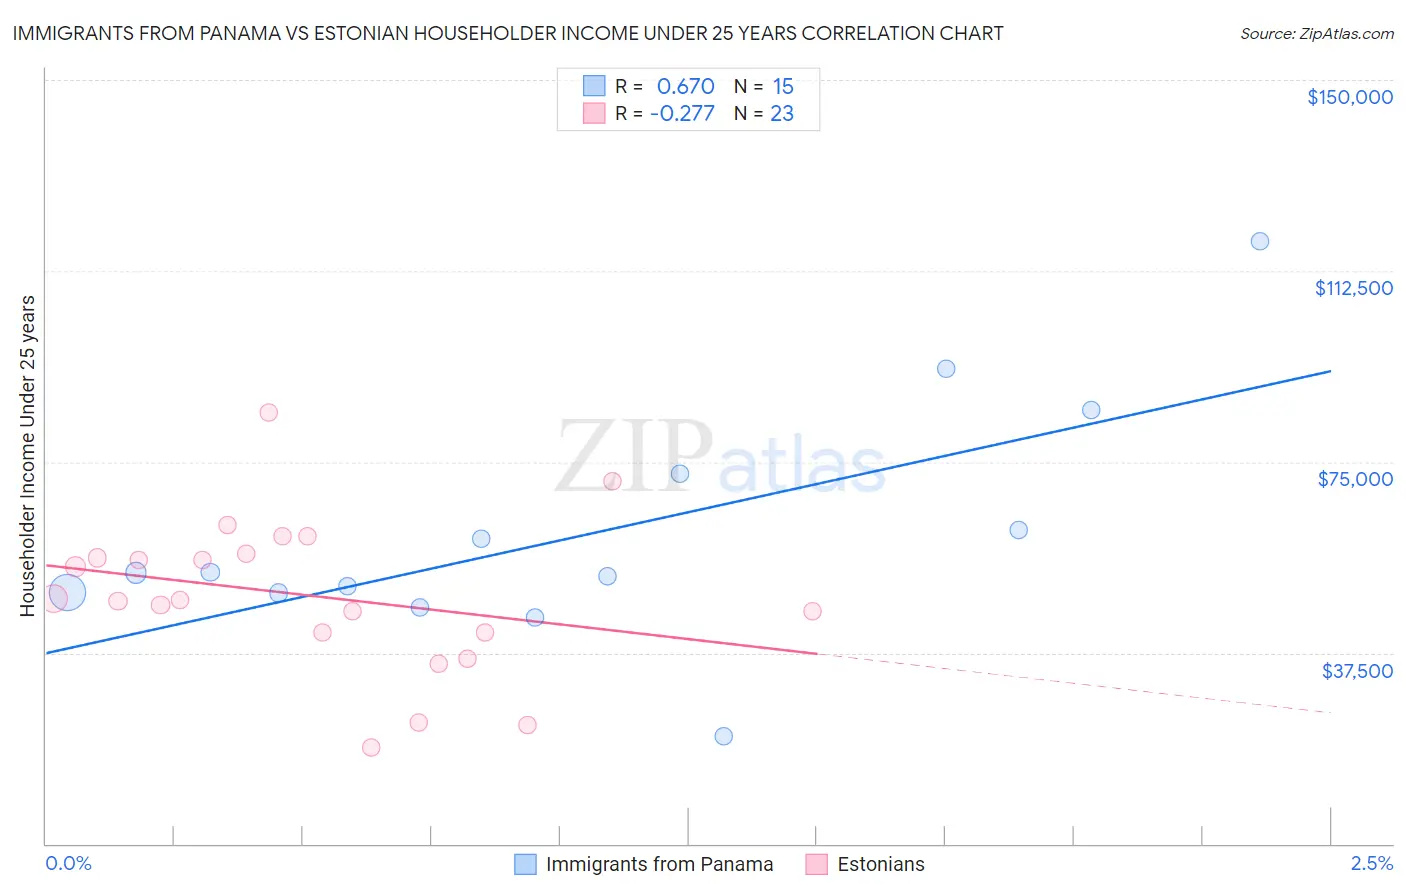
Immigrants from Panama vs Estonian Householder Income Under 25 years Correlation Chart
The statistical analysis conducted on geographies consisting of 198,007,977 people shows a significant positive correlation between the proportion of Immigrants from Panama and household income with householder under the age of 25 in the United States with a correlation coefficient (R) of 0.670 and weighted average of $51,278. Similarly, the statistical analysis conducted on geographies consisting of 111,851,502 people shows a weak negative correlation between the proportion of Estonians and household income with householder under the age of 25 in the United States with a correlation coefficient (R) of -0.277 and weighted average of $51,523, a difference of 0.48%.
Householder Income Under 25 years Correlation Summary
| Measurement | Immigrants from Panama | Estonian |
| Minimum | $21,042 | $18,790 |
| Maximum | $118,375 | $84,706 |
| Range | $97,333 | $65,916 |
| Mean | $60,736 | $48,704 |
| Median | $53,162 | $47,907 |
| Interquartile 25% (IQ1) | $49,230 | $41,381 |
| Interquartile 75% (IQ3) | $72,697 | $56,834 |
| Interquartile Range (IQR) | $23,467 | $15,453 |
| Standard Deviation (Sample) | $23,474 | $15,301 |
| Standard Deviation (Population) | $22,678 | $14,964 |
Demographics Similar to Immigrants from Panama and Estonians by Householder Income Under 25 years
In terms of householder income under 25 years, the demographic groups most similar to Immigrants from Panama are Dutch ($51,265, a difference of 0.030%), Irish ($51,317, a difference of 0.080%), Immigrants from Ghana ($51,333, a difference of 0.11%), Syrian ($51,353, a difference of 0.15%), and Immigrants from Jordan ($51,370, a difference of 0.18%). Similarly, the demographic groups most similar to Estonians are Guatemalan ($51,525, a difference of 0.0%), Palestinian ($51,515, a difference of 0.020%), Pima ($51,503, a difference of 0.040%), Immigrants from Syria ($51,494, a difference of 0.060%), and Swiss ($51,493, a difference of 0.060%).
| Demographics | Rating | Rank | Householder Income Under 25 years |
| Immigrants | Eritrea | 18.1 /100 | #193 | Poor $51,574 |
| Guatemalans | 16.4 /100 | #194 | Poor $51,525 |
| Estonians | 16.4 /100 | #195 | Poor $51,523 |
| Palestinians | 16.1 /100 | #196 | Poor $51,515 |
| Pima | 15.7 /100 | #197 | Poor $51,503 |
| Immigrants | Syria | 15.4 /100 | #198 | Poor $51,494 |
| Swiss | 15.4 /100 | #199 | Poor $51,493 |
| Immigrants | West Indies | 14.9 /100 | #200 | Poor $51,479 |
| British | 14.9 /100 | #201 | Poor $51,477 |
| Immigrants | Guatemala | 14.0 /100 | #202 | Poor $51,447 |
| Immigrants | Cameroon | 13.6 /100 | #203 | Poor $51,433 |
| Czechs | 13.2 /100 | #204 | Poor $51,421 |
| Cape Verdeans | 12.3 /100 | #205 | Poor $51,387 |
| Immigrants | Latin America | 12.3 /100 | #206 | Poor $51,387 |
| South Africans | 12.2 /100 | #207 | Poor $51,383 |
| Immigrants | Jordan | 11.9 /100 | #208 | Poor $51,370 |
| Syrians | 11.4 /100 | #209 | Poor $51,353 |
| Immigrants | Ghana | 10.9 /100 | #210 | Poor $51,333 |
| Irish | 10.6 /100 | #211 | Poor $51,317 |
| Immigrants | Panama | 9.7 /100 | #212 | Tragic $51,278 |
| Dutch | 9.4 /100 | #213 | Tragic $51,265 |