Immigrants from Pakistan vs Immigrants from Egypt Per Capita Income
COMPARE
Immigrants from Pakistan
Immigrants from Egypt
Per Capita Income
Per Capita Income Comparison
Immigrants from Pakistan
Immigrants from Egypt
$47,084
PER CAPITA INCOME
97.9/ 100
METRIC RATING
98th/ 347
METRIC RANK
$47,361
PER CAPITA INCOME
98.5/ 100
METRIC RATING
95th/ 347
METRIC RANK
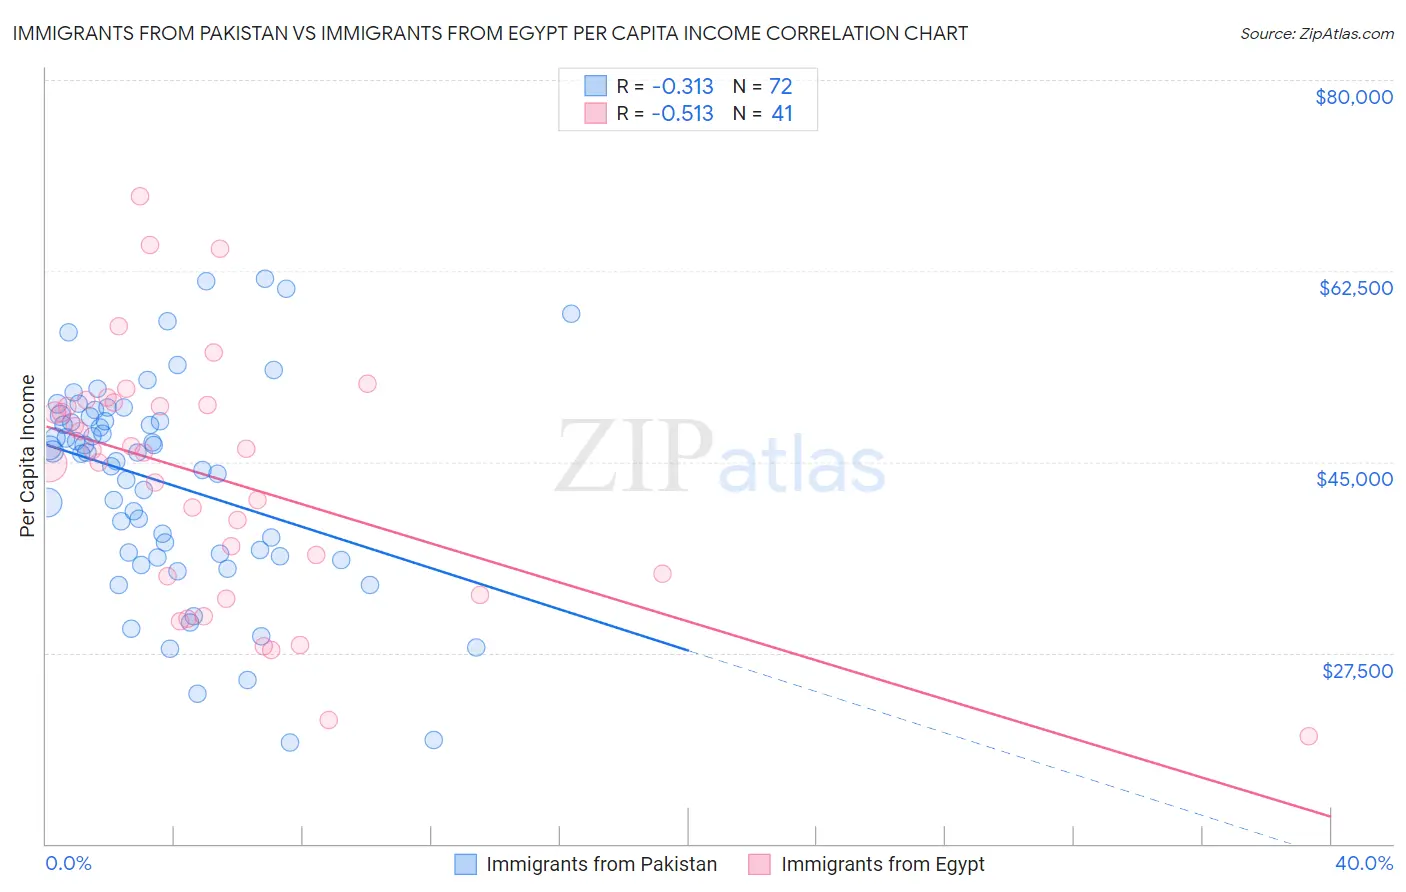
Immigrants from Pakistan vs Immigrants from Egypt Per Capita Income Correlation Chart
The statistical analysis conducted on geographies consisting of 283,918,020 people shows a mild negative correlation between the proportion of Immigrants from Pakistan and per capita income in the United States with a correlation coefficient (R) of -0.313 and weighted average of $47,084. Similarly, the statistical analysis conducted on geographies consisting of 245,495,655 people shows a substantial negative correlation between the proportion of Immigrants from Egypt and per capita income in the United States with a correlation coefficient (R) of -0.513 and weighted average of $47,361, a difference of 0.59%.
Per Capita Income Correlation Summary
| Measurement | Immigrants from Pakistan | Immigrants from Egypt |
| Minimum | $19,245 | $19,900 |
| Maximum | $61,776 | $69,371 |
| Range | $42,531 | $49,471 |
| Mean | $43,079 | $43,359 |
| Median | $45,819 | $45,851 |
| Interquartile 25% (IQ1) | $36,516 | $33,676 |
| Interquartile 75% (IQ3) | $48,924 | $50,334 |
| Interquartile Range (IQR) | $12,409 | $16,658 |
| Standard Deviation (Sample) | $9,561 | $11,446 |
| Standard Deviation (Population) | $9,495 | $11,305 |
Demographics Similar to Immigrants from Pakistan and Immigrants from Egypt by Per Capita Income
In terms of per capita income, the demographic groups most similar to Immigrants from Pakistan are Laotian ($47,041, a difference of 0.090%), Immigrants from Lebanon ($46,938, a difference of 0.31%), Immigrants from Uzbekistan ($46,929, a difference of 0.33%), Carpatho Rusyn ($47,248, a difference of 0.35%), and Alsatian ($47,284, a difference of 0.43%). Similarly, the demographic groups most similar to Immigrants from Egypt are Albanian ($47,379, a difference of 0.040%), Immigrants from Zimbabwe ($47,394, a difference of 0.070%), Alsatian ($47,284, a difference of 0.16%), Carpatho Rusyn ($47,248, a difference of 0.24%), and Immigrants from Moldova ($47,489, a difference of 0.27%).
| Demographics | Rating | Rank | Per Capita Income |
| Immigrants | Southern Europe | 99.3 /100 | #86 | Exceptional $48,027 |
| Ukrainians | 99.3 /100 | #87 | Exceptional $48,014 |
| Croatians | 99.0 /100 | #88 | Exceptional $47,742 |
| Northern Europeans | 98.9 /100 | #89 | Exceptional $47,698 |
| Italians | 98.8 /100 | #90 | Exceptional $47,574 |
| Macedonians | 98.8 /100 | #91 | Exceptional $47,573 |
| Immigrants | Moldova | 98.7 /100 | #92 | Exceptional $47,489 |
| Immigrants | Zimbabwe | 98.5 /100 | #93 | Exceptional $47,394 |
| Albanians | 98.5 /100 | #94 | Exceptional $47,379 |
| Immigrants | Egypt | 98.5 /100 | #95 | Exceptional $47,361 |
| Alsatians | 98.3 /100 | #96 | Exceptional $47,284 |
| Carpatho Rusyns | 98.2 /100 | #97 | Exceptional $47,248 |
| Immigrants | Pakistan | 97.9 /100 | #98 | Exceptional $47,084 |
| Laotians | 97.8 /100 | #99 | Exceptional $47,041 |
| Immigrants | Lebanon | 97.5 /100 | #100 | Exceptional $46,938 |
| Immigrants | Uzbekistan | 97.5 /100 | #101 | Exceptional $46,929 |
| Immigrants | Western Asia | 97.4 /100 | #102 | Exceptional $46,876 |
| Syrians | 97.2 /100 | #103 | Exceptional $46,837 |
| Brazilians | 96.8 /100 | #104 | Exceptional $46,700 |
| British | 96.3 /100 | #105 | Exceptional $46,571 |
| Ethiopians | 96.3 /100 | #106 | Exceptional $46,569 |