Immigrants from Northern Africa vs Immigrants from China Householder Income Under 25 years
COMPARE
Immigrants from Northern Africa
Immigrants from China
Householder Income Under 25 years
Householder Income Under 25 years Comparison
Immigrants from Northern Africa
Immigrants from China
$53,185
HOUSEHOLDER INCOME UNDER 25 YEARS
91.9/ 100
METRIC RATING
134th/ 347
METRIC RANK
$57,931
HOUSEHOLDER INCOME UNDER 25 YEARS
100.0/ 100
METRIC RATING
11th/ 347
METRIC RANK
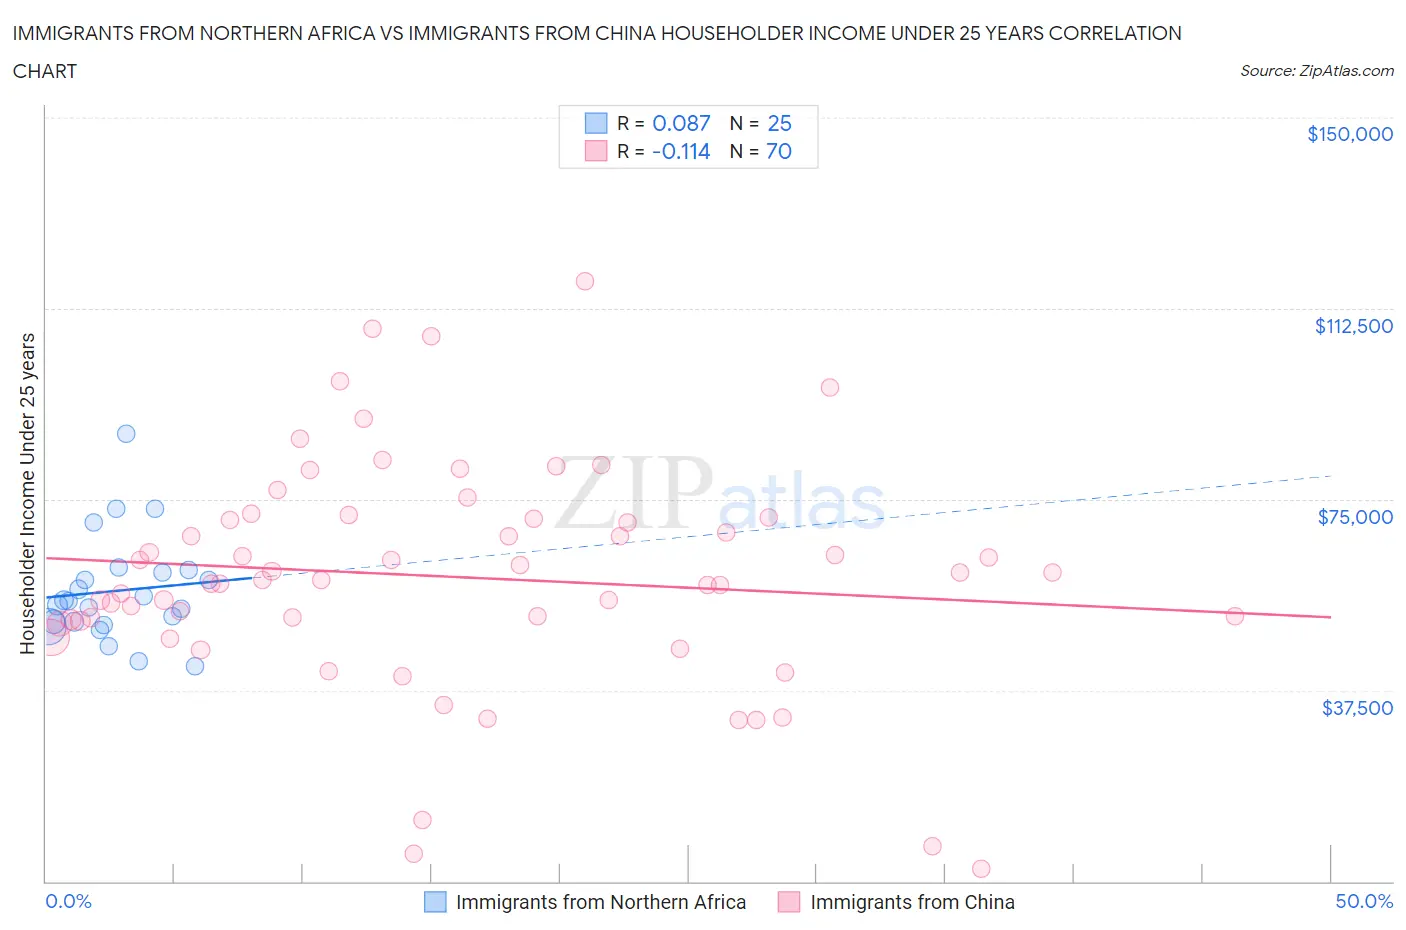
Immigrants from Northern Africa vs Immigrants from China Householder Income Under 25 years Correlation Chart
The statistical analysis conducted on geographies consisting of 276,331,294 people shows a slight positive correlation between the proportion of Immigrants from Northern Africa and household income with householder under the age of 25 in the United States with a correlation coefficient (R) of 0.087 and weighted average of $53,185. Similarly, the statistical analysis conducted on geographies consisting of 376,634,050 people shows a poor negative correlation between the proportion of Immigrants from China and household income with householder under the age of 25 in the United States with a correlation coefficient (R) of -0.114 and weighted average of $57,931, a difference of 8.9%.
Householder Income Under 25 years Correlation Summary
| Measurement | Immigrants from Northern Africa | Immigrants from China |
| Minimum | $42,109 | $2,499 |
| Maximum | $87,806 | $117,772 |
| Range | $45,697 | $115,273 |
| Mean | $57,056 | $59,820 |
| Median | $55,032 | $59,134 |
| Interquartile 25% (IQ1) | $50,695 | $51,147 |
| Interquartile 75% (IQ3) | $60,900 | $71,074 |
| Interquartile Range (IQR) | $10,206 | $19,928 |
| Standard Deviation (Sample) | $10,275 | $22,263 |
| Standard Deviation (Population) | $10,068 | $22,103 |
Similar Demographics by Householder Income Under 25 years
Demographics Similar to Immigrants from Northern Africa by Householder Income Under 25 years
In terms of householder income under 25 years, the demographic groups most similar to Immigrants from Northern Africa are Chilean ($53,185, a difference of 0.0%), Armenian ($53,179, a difference of 0.010%), Immigrants ($53,201, a difference of 0.030%), Immigrants from Barbados ($53,163, a difference of 0.040%), and Norwegian ($53,127, a difference of 0.11%).
| Demographics | Rating | Rank | Householder Income Under 25 years |
| Immigrants | North America | 93.9 /100 | #127 | Exceptional $53,307 |
| Immigrants | Bulgaria | 93.9 /100 | #128 | Exceptional $53,305 |
| New Zealanders | 93.7 /100 | #129 | Exceptional $53,294 |
| Nicaraguans | 93.4 /100 | #130 | Exceptional $53,275 |
| Immigrants | Nicaragua | 93.3 /100 | #131 | Exceptional $53,266 |
| Moroccans | 93.1 /100 | #132 | Exceptional $53,256 |
| Immigrants | Immigrants | 92.2 /100 | #133 | Exceptional $53,201 |
| Immigrants | Northern Africa | 91.9 /100 | #134 | Exceptional $53,185 |
| Chileans | 91.9 /100 | #135 | Exceptional $53,185 |
| Armenians | 91.8 /100 | #136 | Exceptional $53,179 |
| Immigrants | Barbados | 91.5 /100 | #137 | Exceptional $53,163 |
| Norwegians | 90.8 /100 | #138 | Exceptional $53,127 |
| Costa Ricans | 90.4 /100 | #139 | Exceptional $53,106 |
| Hawaiians | 89.8 /100 | #140 | Excellent $53,078 |
| Danes | 88.9 /100 | #141 | Excellent $53,041 |
Demographics Similar to Immigrants from China by Householder Income Under 25 years
In terms of householder income under 25 years, the demographic groups most similar to Immigrants from China are Immigrants from Philippines ($57,930, a difference of 0.0%), Afghan ($58,019, a difference of 0.15%), Immigrants from South Central Asia ($57,818, a difference of 0.20%), Filipino ($57,740, a difference of 0.33%), and Korean ($57,730, a difference of 0.35%).
| Demographics | Rating | Rank | Householder Income Under 25 years |
| Immigrants | Taiwan | 100.0 /100 | #4 | Exceptional $59,424 |
| Immigrants | Bolivia | 100.0 /100 | #5 | Exceptional $59,389 |
| Thais | 100.0 /100 | #6 | Exceptional $59,187 |
| Bolivians | 100.0 /100 | #7 | Exceptional $58,506 |
| Indians (Asian) | 100.0 /100 | #8 | Exceptional $58,239 |
| Chinese | 100.0 /100 | #9 | Exceptional $58,162 |
| Afghans | 100.0 /100 | #10 | Exceptional $58,019 |
| Immigrants | China | 100.0 /100 | #11 | Exceptional $57,931 |
| Immigrants | Philippines | 100.0 /100 | #12 | Exceptional $57,930 |
| Immigrants | South Central Asia | 100.0 /100 | #13 | Exceptional $57,818 |
| Filipinos | 100.0 /100 | #14 | Exceptional $57,740 |
| Koreans | 100.0 /100 | #15 | Exceptional $57,730 |
| Immigrants | Afghanistan | 100.0 /100 | #16 | Exceptional $57,478 |
| Sierra Leoneans | 100.0 /100 | #17 | Exceptional $57,272 |
| Immigrants | Eastern Asia | 100.0 /100 | #18 | Exceptional $57,123 |